. 2025 May 27;10(13):e169105.
doi: 10.1172/jci.insight.169105. eCollection 2025 Jul 8.

Label-free single-cell phenotyping to determine tumor cell heterogeneity in pancreatic cancer in real time

Affiliations

Label-free single-cell phenotyping to determine tumor cell heterogeneity in pancreatic cancer in real time

Katja Wittenzellner et al. JCI Insight. .

Abstract

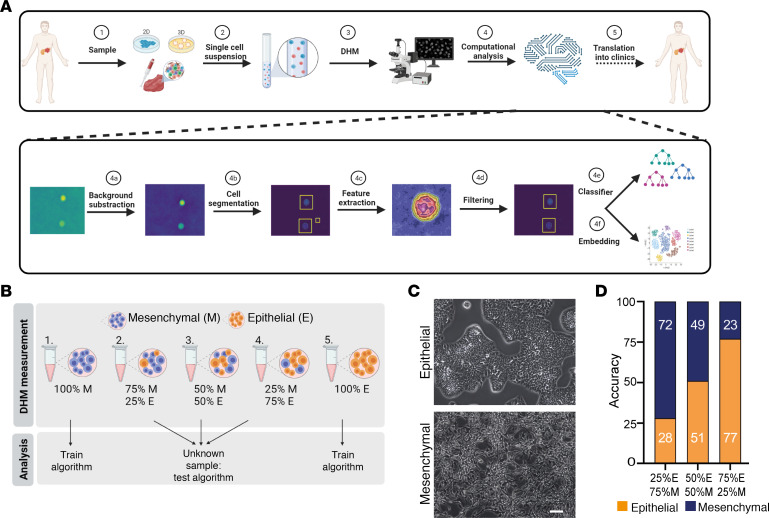
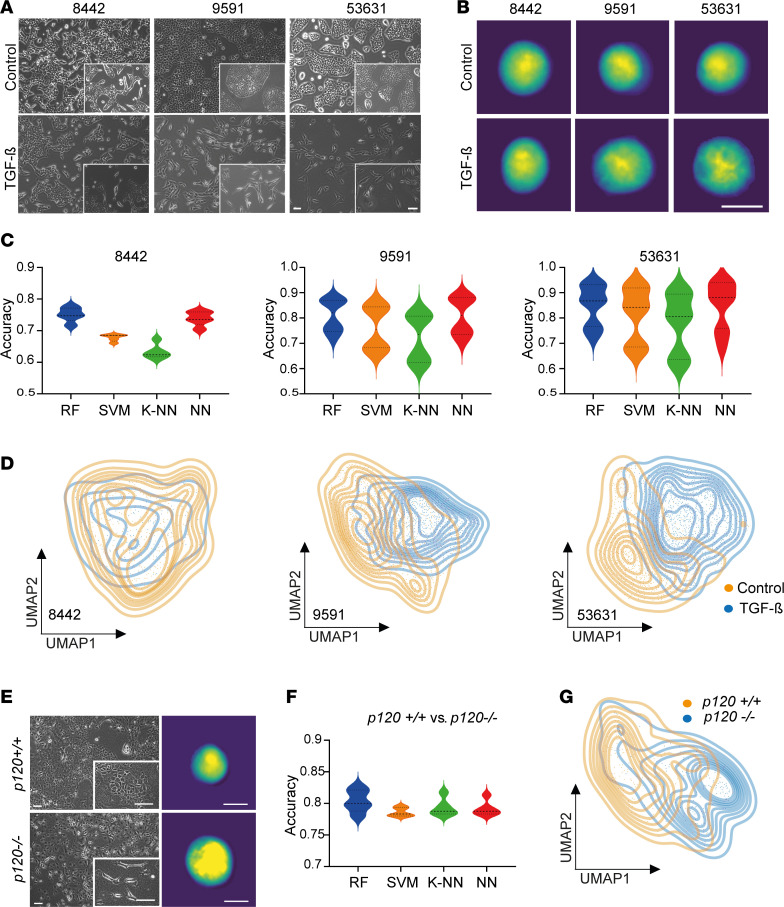
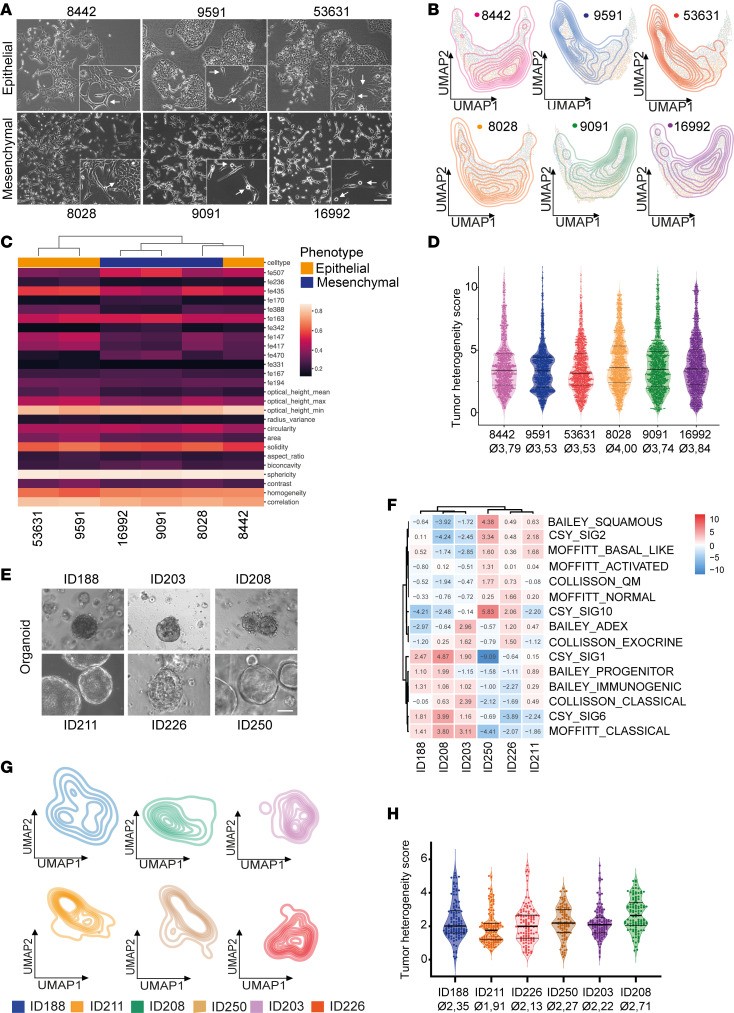
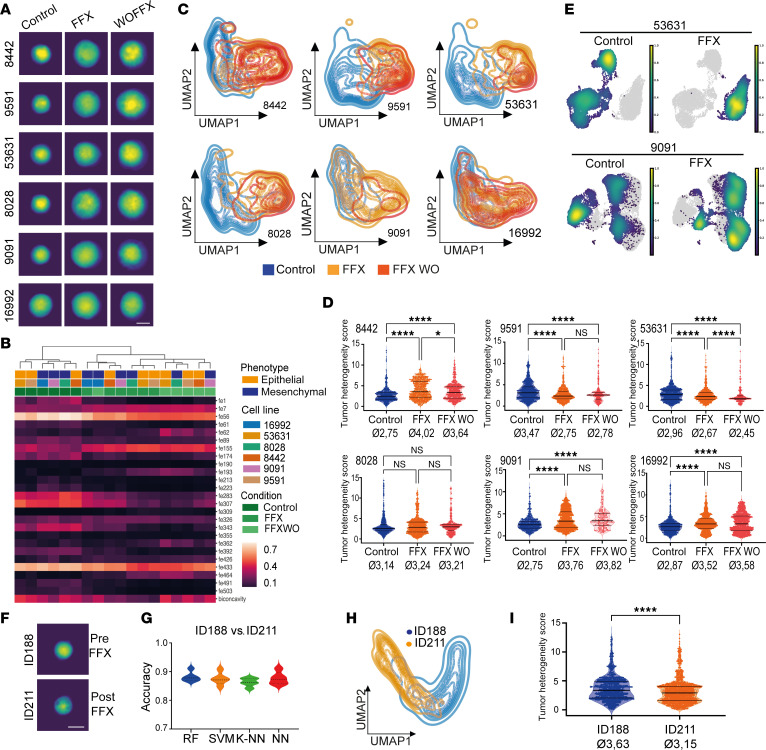
Resistance to chemotherapy of pancreatic ductal adenocarcinoma (PDAC) is largely driven by intratumoral heterogeneity (ITH) due to tumor cell plasticity and clonal diversity. To develop alternative strategies to overcome this defined mechanism of resistance, tools to monitor and quantify ITH in a rapid and scalable fashion are needed urgently. Here, we employed label-free digital holographic microscopy (DHM) to characterize ITH in PDAC. We established a robust experimental and machine learning analysis pipeline to perform single-cell phenotyping based on DHM-derived phase images of PDAC cells in suspension. Importantly, we were able to detect dynamic changes in tumor cell differentiation and heterogeneity of distinct PDAC subtypes upon induction of epithelial-mesenchymal transition and under treatment-imposed pressure in murine and patient-derived model systems. This platform allowed us to assess phenotypic ITH in PDAC on a single-cell level in real time. Implementing this technology into the clinical workflow has the potential to fundamentally increase our understanding of tumor heterogeneity during evolution and treatment response.

Keywords: Cancer; Gastroenterology; Oncology.


Conflict of interest statement

Conflict of interest: KW, CK, OH, and MR have a registered patent for digital holographic microscopy analysis (US20240011888A1).

Figures

Figure 1
Figure 1. Establishing DHM-based single-cell phenotyping to detect tumor cell differentiation.
(A) Schematic illustration of the established workflow and computational analysis pipeline. (B) Schematic illustration of the spike-in experiment setup. (C) Phase contrast images of epithelial (9591) and mesenchymal (16992) cells used in the spike-in experiment. Scale bar indicates 400 μm. (D) Accuracies obtained using random forest classification when trained with 100% epithelial and 100% mesenchymal PDAC cells.
Figure 2
Figure 2. DHM-based identification of TGF-β– and genetically induced EMT.
(A) Phase contrast images of control and TGF-β–treated epithelial PDAC cells. Scale bars represent 200 μm. (B) Representative DHM phase images in false colors of control and TGF-β–treated PDAC cells in suspension. Scale bar represents 10 μm. (C) Accuracy for separating control and TGF-β–treated PDAC cells individually for every cell line using different classification methods: random forest (RF), support vector machine (SVM), k-nearest neighbors (K-NN), and neural network (NN). Shown are the median and upper and lower quartiles. (D) Unsupervised clustering of control and TGF-β–treated PDAC cells based on DHM phase images and visualized using UMAP plots. (E) Representative phase contrast (left) and DHM phase images in false colors (right) of cells with p120catenin wild-type (p120+/+) or homozygous (p120–/–) deletion. Scale bars represent 200 μm (left) and 10 μm (right). (F) Accuracy for separating p120+/+ and p120–/– cells using different classification methods as in C. Shown are the median and upper and lower quartiles. (G) Unsupervised clustering of p120+/+ and p120–/– cells based on DHM phase images and visualized using UMAP plots.
Figure 3
Figure 3. Single-cell phenotyping identifies heterogeneity in murine and human PDAC models.
(A) Phase contrast images of epithelial and mesenchymal PDAC cells. Arrows indicate subpopulations of the opposing phenotype. Scale bars represent 200 μm. (B) Unsupervised clustering of individual cell lines based on DHM phase images visualized using UMAP plots. (C) Hierarchical clustering of DHM phase images derived from epithelial and mesenchymal PDAC cells based on the most different ResNet18 and morphological features. (D) Evaluation of intra–cell line heterogeneity using single-cell distance to cluster centroid. Kruskal-Wallis test, P < 0.0001. Shown are the median and upper and lower quartiles. Ø, mean tumor heterogeneity score. (E) Phase contrast images of patient-derived PDAC organoids. Scale bar represents 200 μm. (F) Molecular subtype classifier gene sets applied to transcriptomic profiles of PDOs. (G) Unsupervised clustering of individual PDAC organoid lines based on DHM phase images and visualized using UMAP plots. (H) Evaluation of intra–organoid line heterogeneity using single-cell distance to cluster centroid. Kruskal-Wallis test, P < 0.0001. Shown are the median and upper and lower quartiles.
Figure 4
Figure 4. Monitoring single-cell phenotypes and heterogeneity in response to treatment.
(A) Representative single-cell DHM phase images of untreated, FFX-treated, or FFX washout murine PDAC cells in suspension. Scale bar indicates 10 μm. (B) Hierarchical clustering of DHM phase images derived from murine PDAC cells in untreated, FFX-treated, or FFX washout condition based on the most different ResNet18 and morphological features. (C) Unsupervised clustering of different conditions in the individual cell lines based on DHM phase images and visualized using UMAP plots. (D) Evaluation of intra–cell line heterogeneity upon FFX treatment using single-cell distance to cluster centroid. Kruskal-Wallis test: *P < 0.05 and ****P < 0.0001. Shown are the median and upper and lower quartiles. (E) Kernel density of untreated and FFX-treated epithelial (53631) and mesenchymal (9091) cells analyzed using single-cell RNA-sequencing data. (F) Representative single-cell DHM phase images of pre– (ID188) and post– (ID211) FFX-treated PDOs in suspension. Scale bar indicates 10 μm. (G) Accuracy for separating organoids before and after FOLFIRINOX treatment using different classification methods: RF, SVM, K-NN, and NN. Shown are the median and upper and lower quartiles. (H) Unsupervised clustering of ID188 and ID211 organoids based on DHM phase images and visualized using UMAP plots. (I) Evaluation of intra–organoid line heterogeneity of ID188 and ID211 using single-cell distance to cluster centroid. Mann-Whitney test, ****P < 0.0001. Shown are the median and upper and lower quartiles.

Similar articles

References

    1. Siegel RL, et al. Cancer statistics, 2022. CA Cancer J Clin. 2022;72(1):7–33. doi: 10.3322/caac.21708. - DOI - PubMed
    1. Conroy T, et al. FOLFIRINOX versus gemcitabine for metastatic pancreatic cancer. N Engl J Med. 2011;364(19):1817–1825. doi: 10.1056/NEJMoa1011923. - DOI - PubMed
    1. Von Hoff DD, et al. Increased survival in pancreatic cancer with nab-paclitaxel plus gemcitabine. N Engl J Med. 2013;369(18):1691–1703. doi: 10.1056/NEJMoa1304369. - DOI - PMC - PubMed
    1. Hu HF, et al. Mutations in key driver genes of pancreatic cancer: molecularly targeted therapies and other clinical implications. Acta Pharmacol Sin. 2021;42(11):1725–1741. doi: 10.1038/s41401-020-00584-2. - DOI - PMC - PubMed
    1. Pishvaian MJ, et al. Overall survival in patients with pancreatic cancer receiving matched therapies following molecular profiling: a retrospective analysis of the Know Your Tumor registry trial. Lancet Oncol. 2020;21(4):508–518. doi: 10.1016/S1470-2045(20)30074-7. - DOI - PMC - PubMed