. 2025 Jun 3;122(22):e2417149122.
doi: 10.1073/pnas.2417149122. Epub 2025 May 27.

The IL-18 receptor is expressed on murine small-intestinal enterochromaffin cells and executes a recovery program upon injury

Affiliations

The IL-18 receptor is expressed on murine small-intestinal enterochromaffin cells and executes a recovery program upon injury

Nathaniel J Winsor et al. Proc Natl Acad Sci U S A. .

Abstract

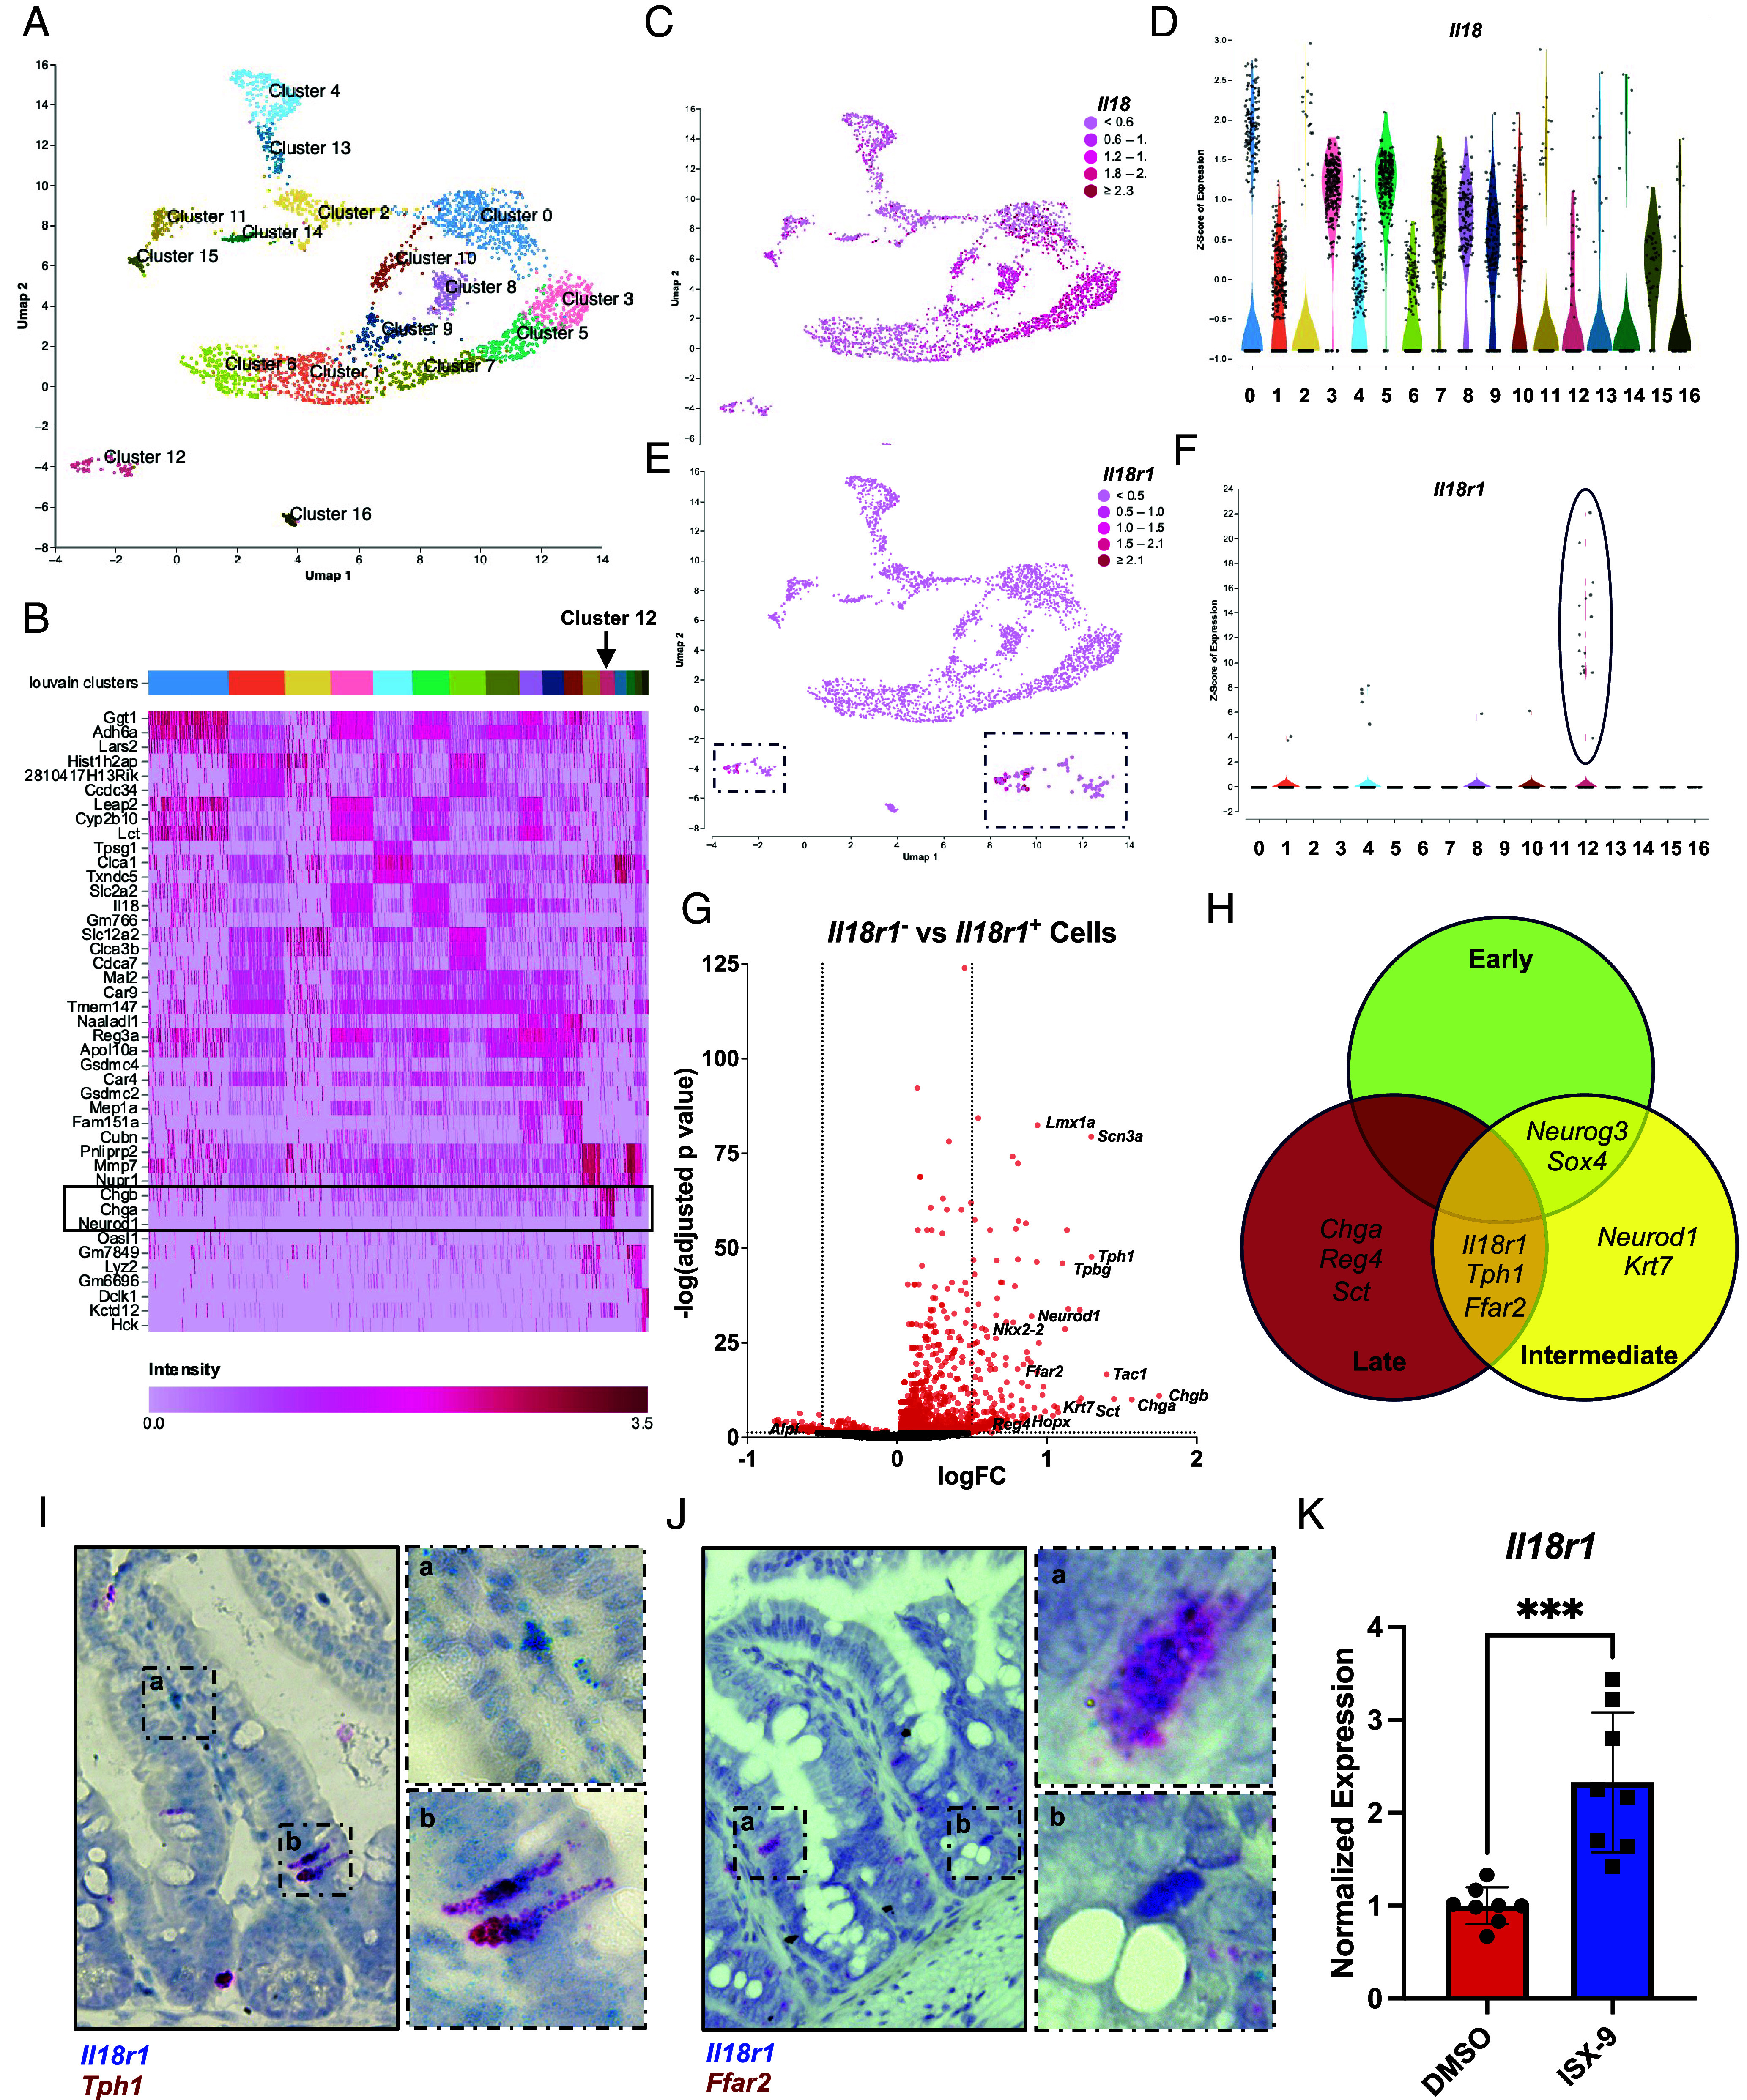
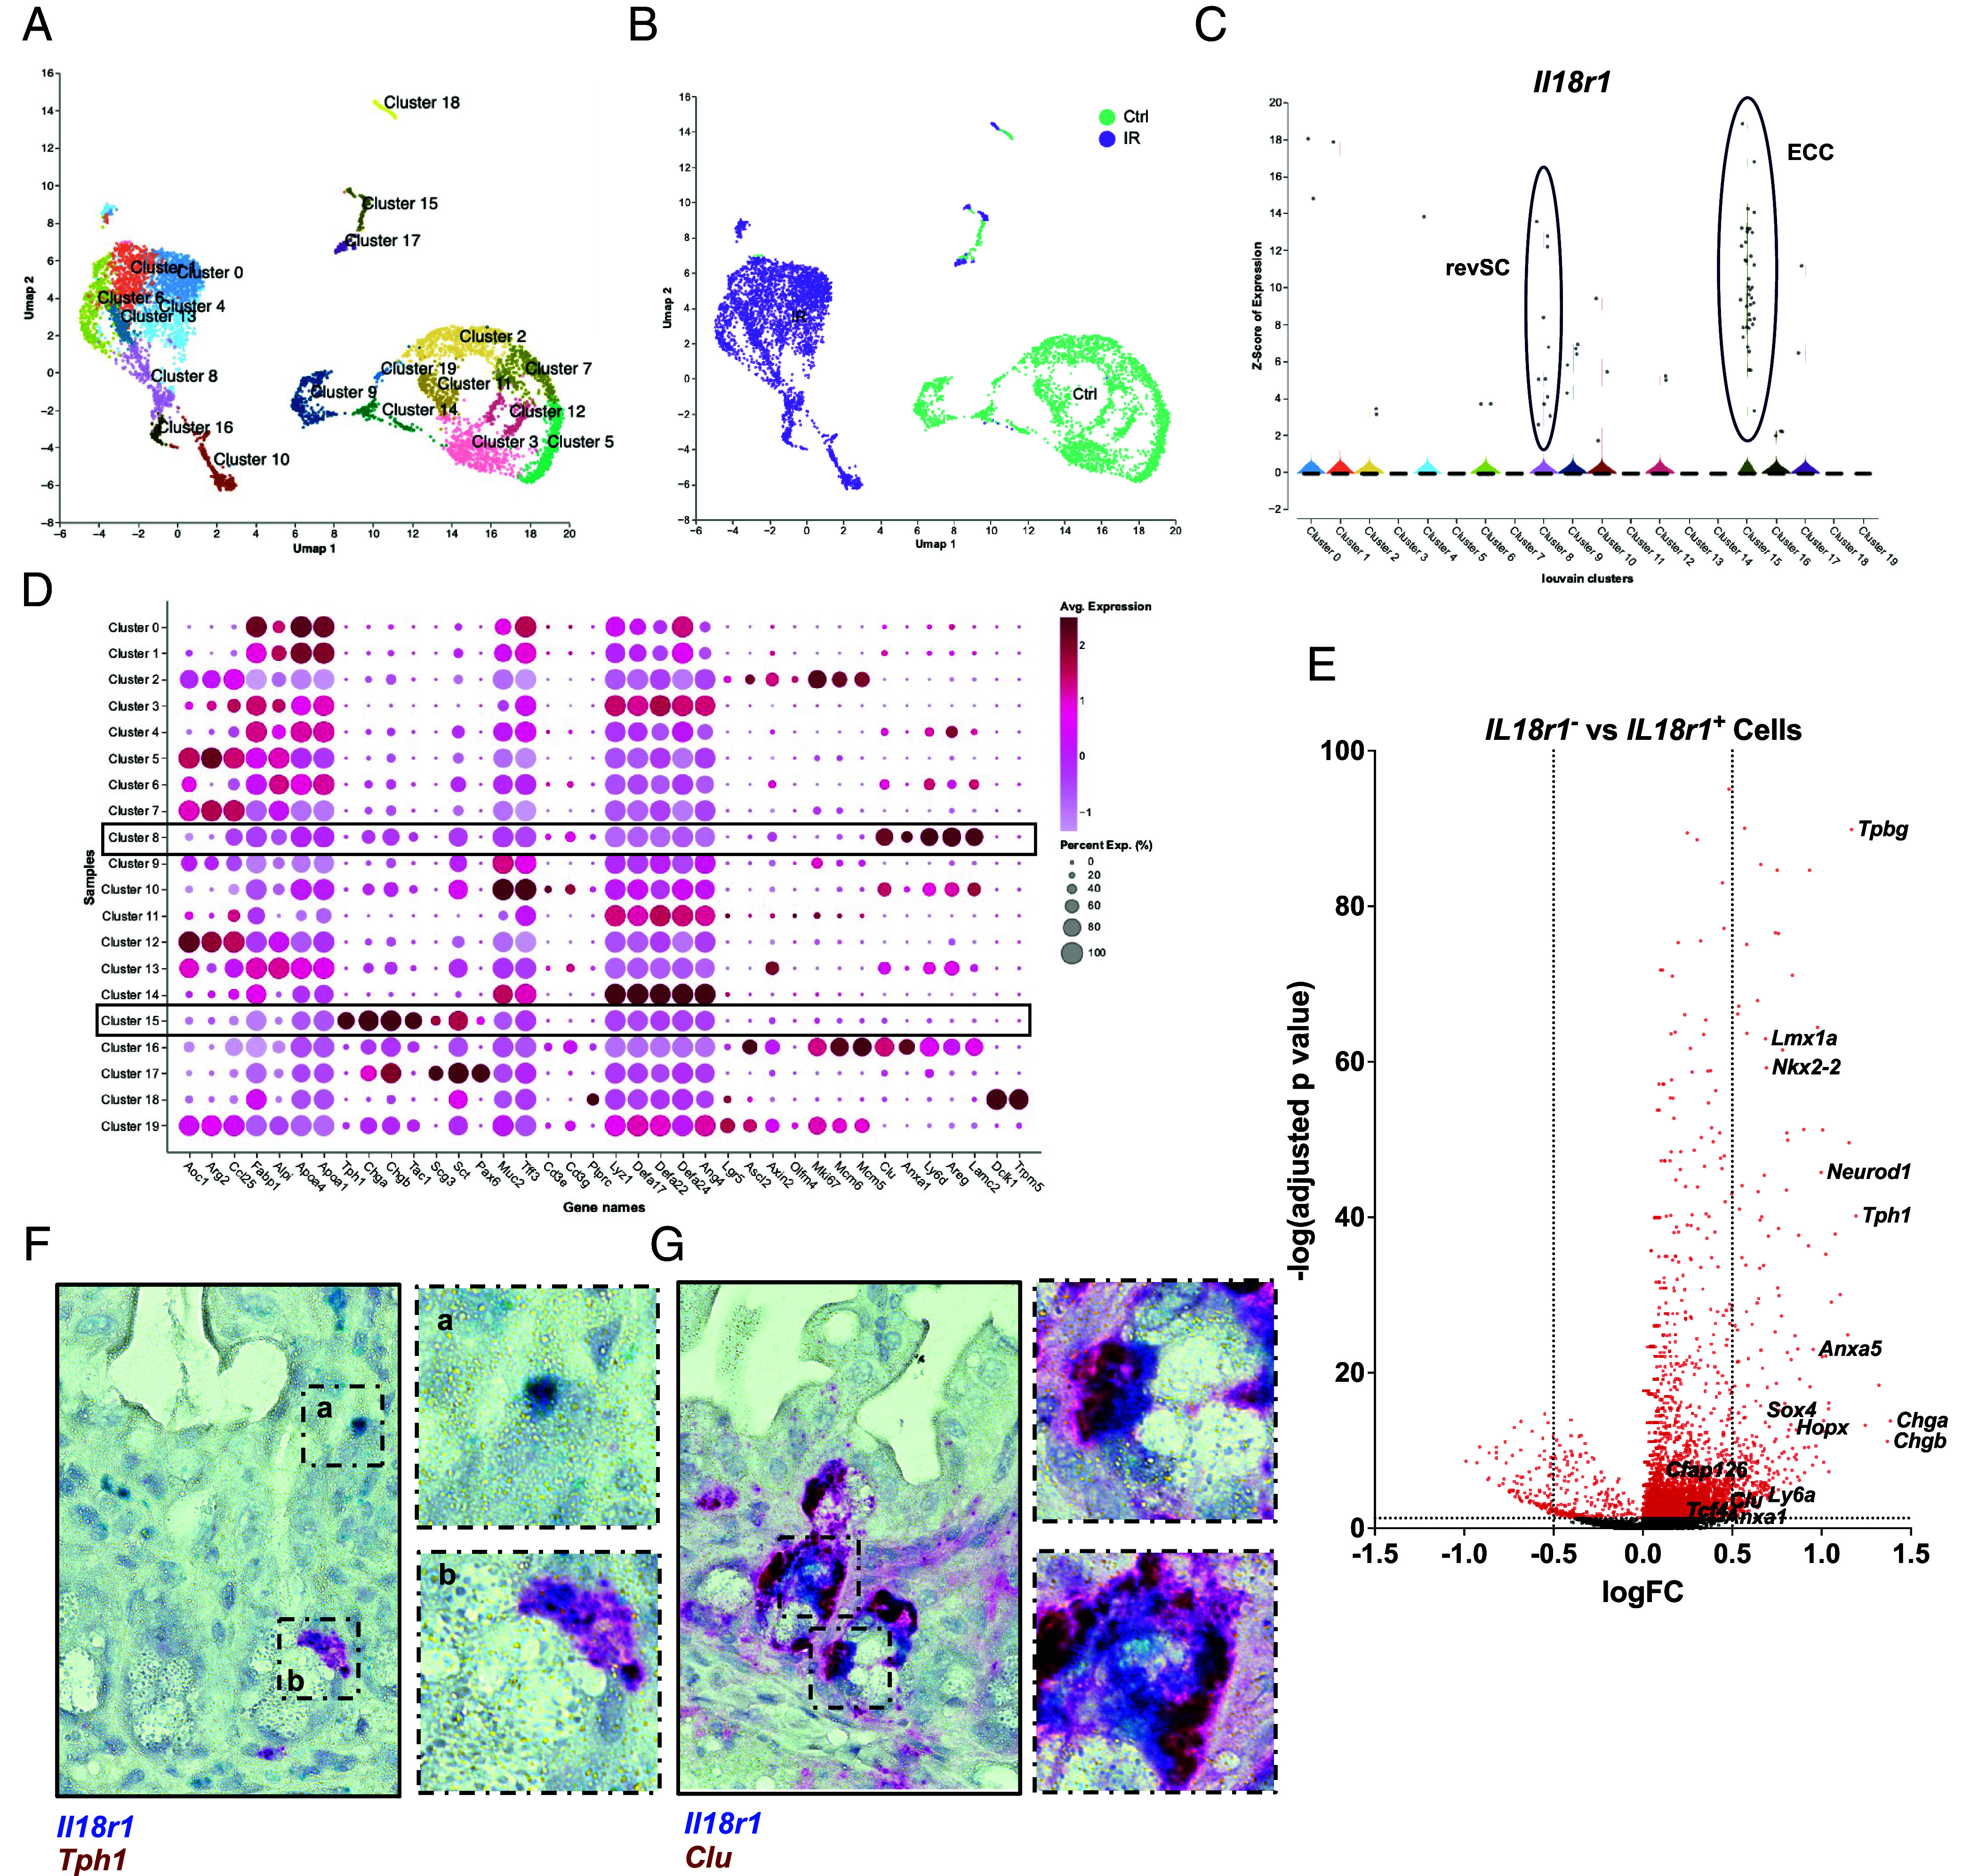
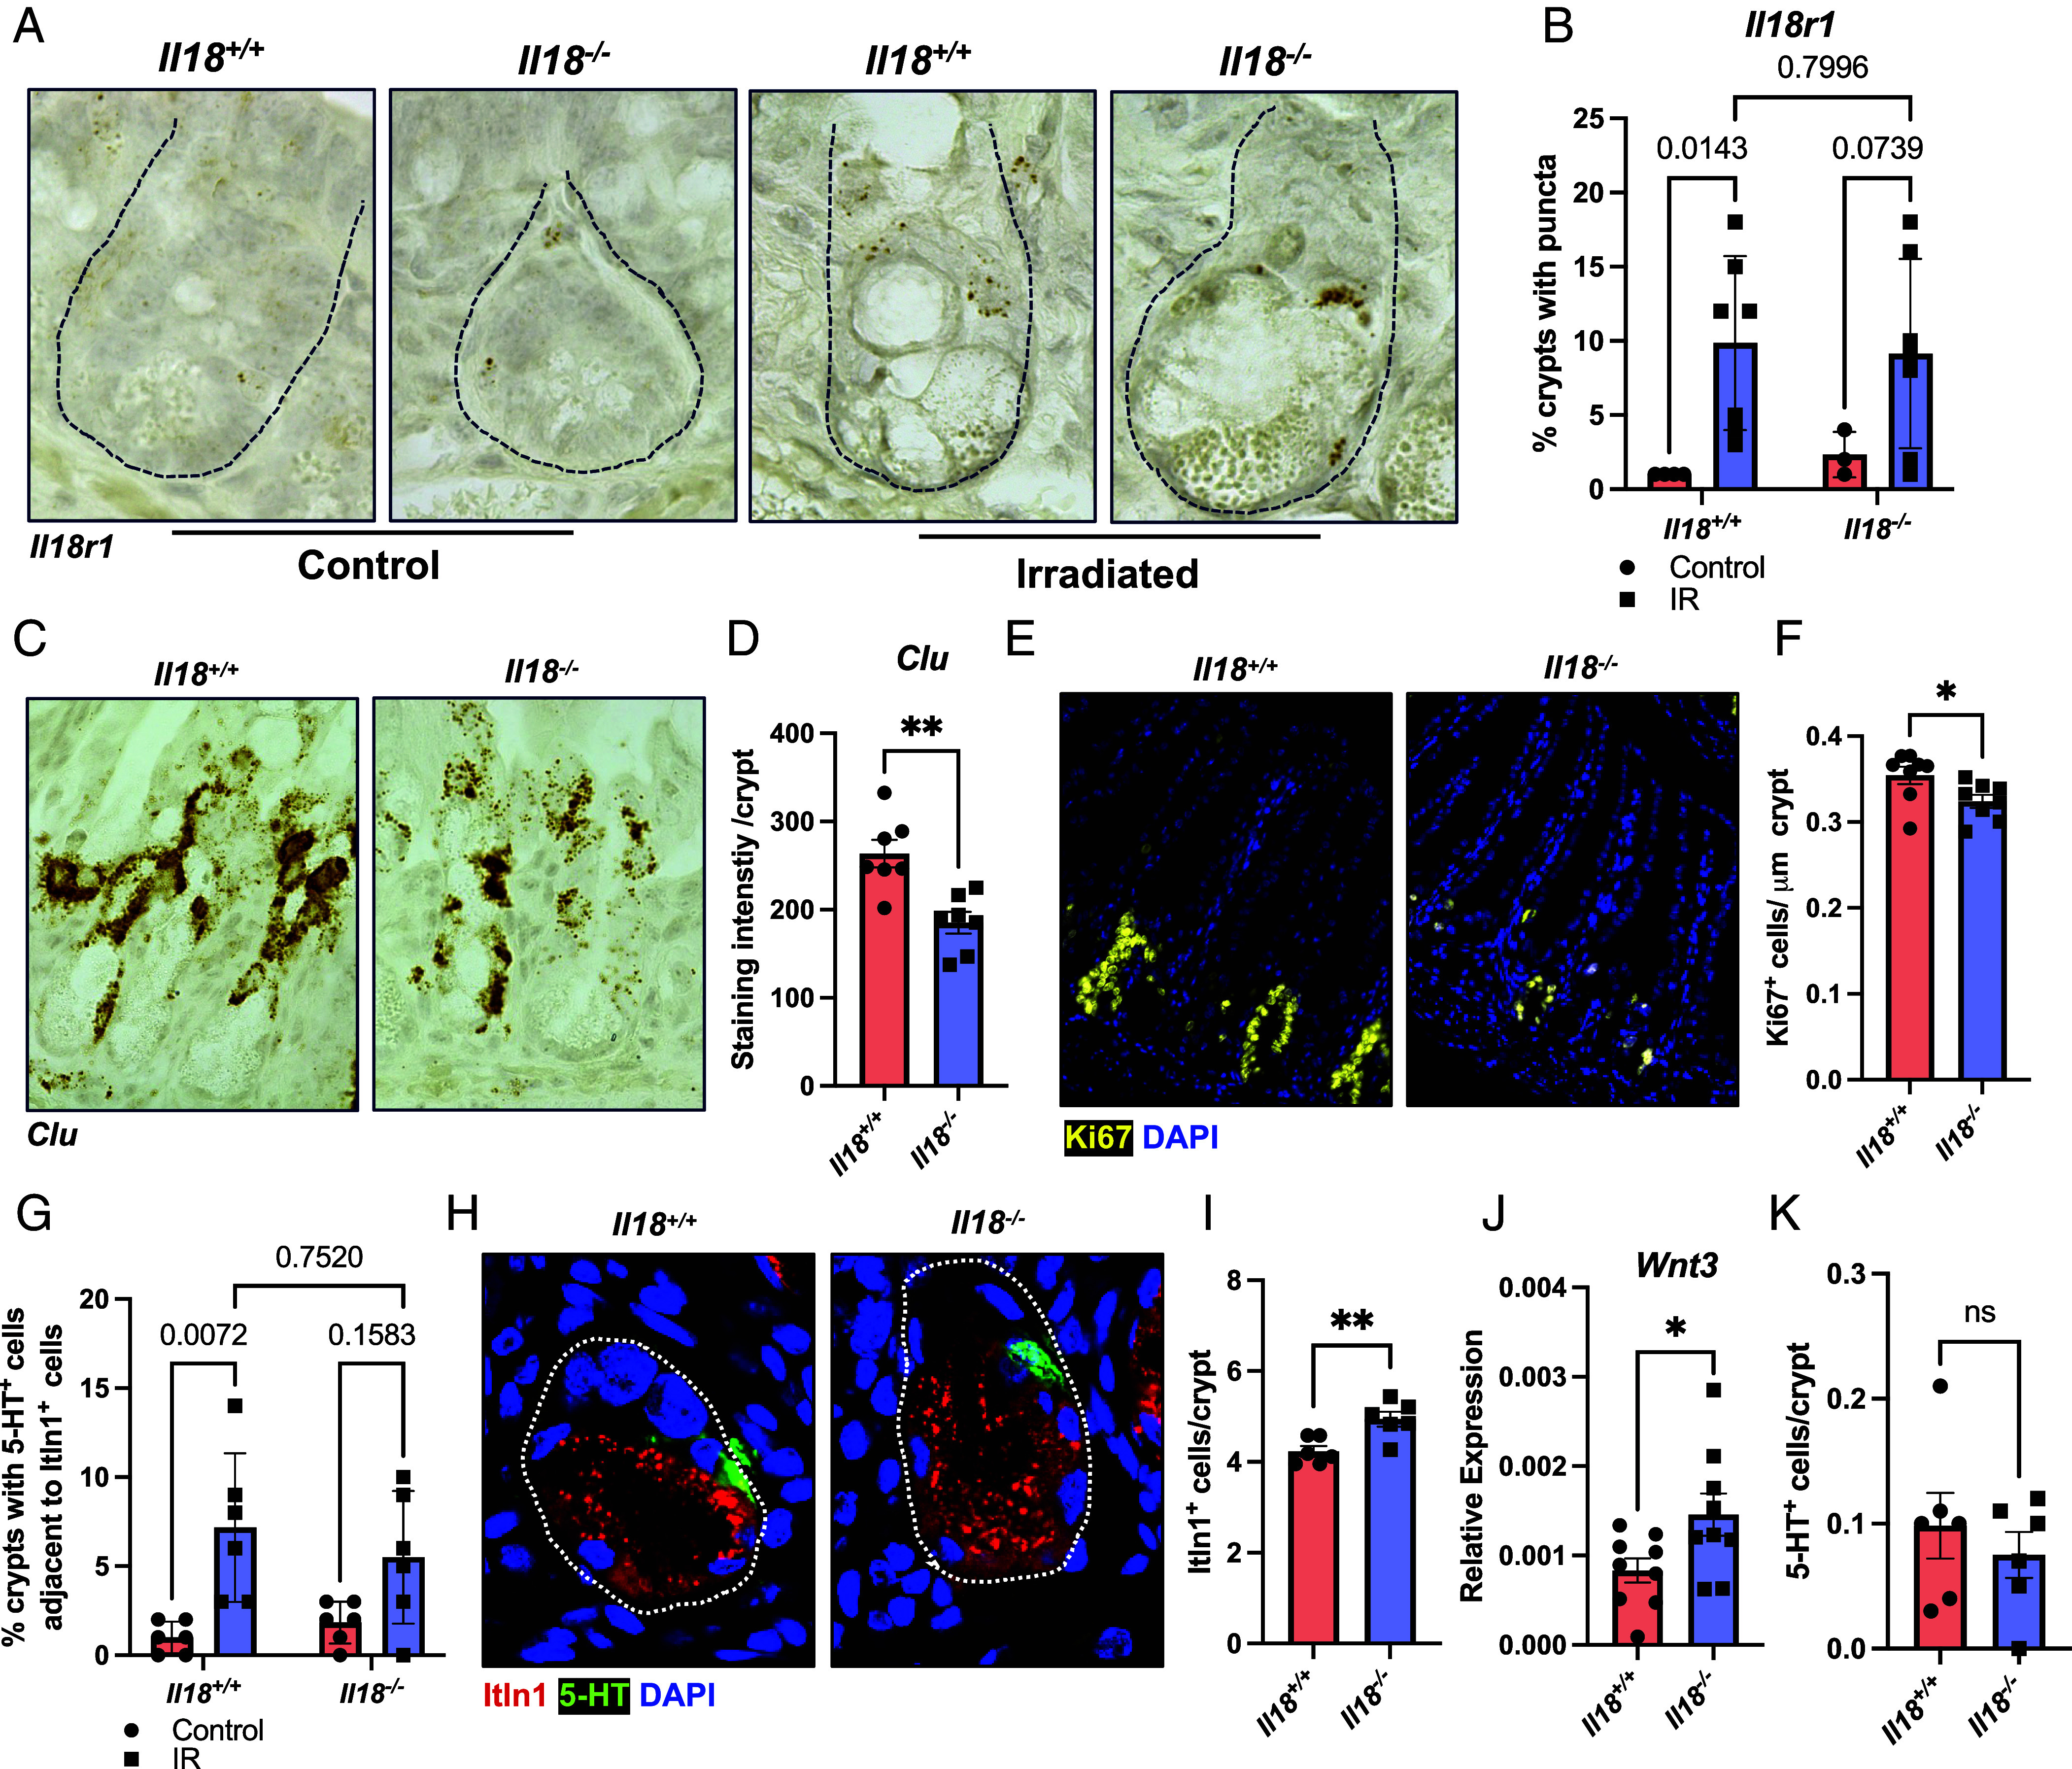
Upon injury, epithelial-derived IL-18 is released and induces an inflammatory response in underlying IL18R1+ lamina propria cells. Notably, Il18r1 is also predicted to be expressed and functional in intestinal epithelial cells (IECs), since epithelial IL18R1 deficiency contributes to worsened outcomes upon inflammatory challenge. However, the nature of Il18r1+ IECs, and their subsequent role in epithelial-intrinsic IL-18 signaling is poorly characterized. Here, we show that, in the murine small intestine, the IL-18 receptor is expressed by rare IECs that we identified to be a subset of enterochromaffin cells (ECC). While these cells are the major producers of serotonin in the intestine, we found no evidence that IL-18 regulated serotonin metabolism or release. Rather, upon radiation-induced injury, Il18r1+ cells appeared in the crypt base and took on a revival stem cell (revSC) program, marked by mixed expression of YAP/TAZ and enteroendocrine genes signatures. Functionally, irradiated Il18-/- mice display reduced epithelial proliferation and altered differentiation in the small intestine, characterized by increased Paneth cells (PC) and elevated Wnt3 levels, which was partially recapitulated in Il18-/- ileal organoids. In sum, we identified an Il18r1+ population in the epithelium and revealed a role for IEC-intrinsic IL-18 signaling during injury.

Keywords: IL-18 receptor; enterochromaffin cells; inflammasomes; intestinal injury; revival stem cells.


Conflict of interest statement

Competing interests statement:The authors declare no competing interest.

Figures

Fig. 1.
Fig. 1.
The IL-18 receptor is discreetly expressed in a rare intestinal epithelial cell (IECs) population. (A) Representative images of RNA in situ hybridization for stated inflammasome transcripts in the murine ileum. Enlarged areas indicated by red boxes. n > 2 per probe. (B) Heatmap of stated inflammasome transcripts within ileal enterocytes, clustered according to spatial-transcriptomic profiling of murine crypt–villus axis from intestinal stem cells (ISC) through TA (TA1-TA2) and villus (V1–V6) regions. Accessed from NCBI GEO: GSE195742.
Fig. 2.
Fig. 2.
Enterochromaffin cells (ECC) are the predominant Il18r1+ population in the murine small intestine. (A) UMAP of murine small-intestinal IECs with Louvain clusters labeled. Accessed from NCBI GEO: GSE123516. (B) Heatmap of Louvain clusters with top three genes identified per cluster. Cluster 12 is identified with a box and arrow. (C) Expression of Il18 overlaid on UMAP plot. (D) Violin plot of expression of Il18 in each Louvain cluster. (E) Expression of Il18r1 overlaid on UMAP plot. (F) Violin plot of expression of Il18r1 in each Louvain cluster, with cluster 12 is highlighted. (G) Volcano plot of differential expression of Il18r1+ vs Il18r1 cells (P < 0.05, log2FC > 0.5). (H) Venn diagram of selected population-specific genes (P < 0.01, log2FC > 1.5) from bulk RNA-seq on small-intestinal IECs of FACS-sorted Neurog3Chrono mice. Accessed from NCBI GEO: GSE113561. (I) Duplex RNA in situ hybridization in ileal tissue showing colocalization of Il18r1 and Tph1 transcripts in ileal ECC (n > 2). Enlarged areas indicated by hashed. boxes, displaying staining in Il18r1+ immune cells (a) and double-positive ECC (b). n > 2 per probe. (J) Duplex RNA in situ hybridization in ileal tissue showing colocalization of Il18r1 and Ffar2 transcripts in ileal ECC (n > 2). Enlarged areas indicated by hashed boxes, displaying double (a) and single positive IECs (b). n > 2 per probe. (K) RT-qPCR for Il18r1 from wild-type ileal organoids treated with ISX-9 for 48 h. Data were analyzed with Student’s t test. Mean ± SD is shown with ***P ≤ 0.001. n = 8 from 4 biologic repeats.
Fig. 3.
Fig. 3.
IL-18 does not induce 5-HT release from ECC. (A) Representative image of 5-HT+ ECC in the ileum of wild-type GF, SPF colonized Il18+/+ and SPF colonized Il18−/− mice. (B) Quantification of 5-HT+ ECC in the ileum of wild-type GF, SPF colonized Il18+/+ and SPF colonized Il18−/− mice. One point represents one mouse. One-way ANOVA with Tukey’s multiple comparisons test. Mean ± SEM with ns (nonsignificant), *P ≤ 0.05 and **P ≤ 0.01 displayed. (C and D) Frequency of 5-HT+ ECC in the crypt (C) or villi (D) of wild-type GF, SPF colonized Il18+/+ and SPF colonized Il18−/− mice. One point represents one mouse. One-way ANOVA with Tukey’s multiple comparisons test. Mean ± SEM with ns (nonsignificant) and *P ≤ 0.05 displayed. (E) ELISA of circulating 5-HT levels from whole blood of wild-type GF, SPF colonized Il18+/+ and SPF colonized Il18−/− mice, normalized to SPF Il18+/+ mice. One point represents one mouse. One-way ANOVA with Tukey’s multiple comparisons test. Mean ± SD with ns (nonsignificant), **P ≤ 0.01 and ***P ≤ 0.001 displayed. (F) ELISA of circulating 5-HT levels from whole blood of wild-type mice intraperitoneally injected with rIL-18 for stated timepoints. Normalized to control (sham) mice. One point represents one mouse. One-way ANOVA with Dunnett’s multiple comparisons test. Mean ± SD with ns (nonsignificant) displayed. (G) Whole tissue immunoblot of wild-type GF, SPF colonized Il18+/+ and SPF colonized Il18−/− ileum for stated inflammasome components. Each lane represents one mouse. (H) RT-qPCR of Tph1 transcripts from wild-type ileal organoids treated with rIL-18 or thapsigargin (thapsi) for 6 h. One-way ANOVA with Dunnett’s multiple comparisons test. Mean ± SD with ns (nonsignificant) and ****P ≤ 0.0001 displayed. n = 12 from 4 biological repeats. (I) RT-qPCR of Tph1 transcripts from Il18+/+ and Il18−/− ileal organoids treated with FlaTox for 6 h. Two-way ANOVA with Tukey’s multiple comparisons test. Mean ± SD is shown with ns (nonsignificant) displayed. n = 6 from 3 biological repeats.
Fig. 4.
Fig. 4.
Il18r1 appears on a subset of revSCs following irradiation induced injury. (A) UMAP of murine small-intestinal IECs from control and irradiated animals with Louvain clusters labeled. Accessed from NCBI GEO: GSE123516. (B) Treatment groups overlaid on UMAP plot. (C) Violin plot of expression of Il18r1 in each Louvain cluster, with revSCs (Cluster 8) and ECC (Cluster 15) highlighted. (D) Dot plot of marker genes for indicated IEC clusters with revSC (Cluster 8) and ECC (Cluster 15) highlighted. (E) Volcano plot of differential expression of Il18r1 vs Il18r1+ cells (P < 0.05, log2FC > 0.5) from the irradiated treatment group. (F) Duplex RNA in situ hybridization in ileal tissue showing colocalization of Il18r1 and Tph1 transcripts in crypt residing cells, 72 h post-IR (n > 2). Enlarged areas indicated by hashed boxes, displaying staining in Il18r1+ immune cells (a) and double-positive ECC (b). n > 2 per probe. (G) Duplex RNA in situ hybridization in ileal tissue showing colocalization of Il18r1 and Clu transcripts in crypt cells, 72 h post-IR (n > 2). Enlarged areas indicated by hashed boxes.
Fig. 5.
Fig. 5.
IL-18 regulates proliferation in the regenerating crypt. (A) Representative image of RNA in situ hybridization for Il18r1 transcripts in ileal crypt-resident cells from Il18+/+ and Il18−/− animals at baseline and 72 h post-IR. Crypts indicated by hashed lines. (B) Quantification of the frequency of crypts with Il18r1 staining relative to total crypts from Il18+/+ and Il18−/− animals at baseline and 72 h post-IR. One point represents one mouse. Two-way ANOVA with Tukey’s multiple comparisons test. Mean ± SEM is shown with indicated P values. (C) Representative image of RNA in situ hybridization for Clu transcripts in the crypts of Il18+/+ and Il18−/− animals 72 h post-IR. (D) Quantification of Clu staining intensity in the crypts of Il18+/+ and Il18−/− animals 72 h post-IR. One point represents one mouse. Data were analyzed with Student’s t test. Mean ± SEM is shown with **P ≤ 0.01 displayed. (E) Representative image of Ki67+ cells of Il18+/+ and Il18−/− mice 72 h post-IR. (F) Quantification Ki67+ cells of Il18+/+ and Il18−/− mice 72 h post-IR, standardized to crypt length. One point represents one mouse. Data were analyzed with Student’s t test. Mean ± SEM is shown with *P ≤ 0.05 displayed. (G) Quantification of the frequency of crypts with 5-HT+ cells adjacent to Itln1+ cells, relative to total crypts, from Il18+/+ and Il18−/− animals at baseline and 72 h post-IR. One point represents one mouse. Two-way ANOVA with Tukey’s multiple comparisons test. Mean ± SEM is shown with indicated P values. (H) Representative image of Itln1+ Paneth and 5-HT+ ECC in the crypt of Il18+/+ and Il18−/− mice 72 h post-IR. Crypts indicated with hashed line. (I) Quantification of Itln1+ Paneth cells (PC) in the crypt of Il18+/+ and Il18−/− animals 72 h post-IR. One point represents one mouse. Data were analyzed with Student’s t test. Mean ± SEM is shown with *P ≤ 0.05 displayed. (J) RT-qPCR for Wnt3 transcripts from ileal tissue of Il18+/+ and Il18−/− animals 72 h post-IR. One point represents one mouse. Data were analyzed with Student’s t test. Mean ± SD is shown with *P ≤ 0.05 displayed. (K) Quantification of 5-HT+ cells in the crypt of Il18+/+ and Il18−/− animals 72 h post-IR. One point represents one mouse. Data were analyzed with Student’s t test. Mean ± SEM is shown with nonsignificance (ns) displayed.
Fig. 6.
Fig. 6.
Epithelial intrinsic IL-18 signaling regulates absorptive cell differentiation. (A) Representative brightfield image of Il18+/+ and Il18−/− organoids, 24 h postpassage. (B) Violin plot of the area of cystic Il18+/+ and Il18−/− organoids, 24 h postpassage. Data were analyzed with Student’s t test. Mean ± SD is shown with ****P ≤ 0.0001. Data pooled from 3 biologic repeats. (C) Representative image of Itln1+ PC in Il18+/+ and Il18−/− organoids, 24 h postpassage. (D) Quantification of Itln1+ PC in Il18+/+ and Il18−/− organoids, 24 h postpassage. Data were analyzed with Student’s t test. Mean ± SEM is shown with *P ≤ 0.05 displayed. n = 5. (E) RT-qPCR for stated transcripts from Il18+/+ and Il18−/− organoids 24 h postpassage. Data were analyzed with Student’s t test. Mean ± SD is shown with *P ≤ 0.05, **P ≤ 0.01 and ****P ≤ 0.0001 displayed. n = 8 from 4 biological repeats. (F) Frequency of cystic (<1 crypt-bud) or budding (2 + crypt-buds) organoids from Il18+/+ and Il18−/− mice, 72 h postpassage. Data were analyzed with Student’s t test. Mean ± SD is shown with *P ≤ 0.05 displayed, n = 4. (G) Violin plot of number of crypt-buds in budding organoids from Il18+/+ and Il18−/− mice, 72 h postpassage. Data were analyzed with Student’s t test. Mean ± SD is shown with nonsignificance (ns) displayed. Data pooled from 4 biologic repeats. (H) Representative brightfield image of Il18+/+ and Il18−/− organoids, 72 h postpassage. (I) Representative image of Itln1+ PC and Ki67+ cells in crypt-buds of Il18+/+ and Il18−/− organoids, 72 h postpassage. (J and K) Quantification of Ki67+ (J) and Itln1+ Paneth (K) cells as a frequency of DAPI+ cells per crypt-bud of Il18+/+ and Il18−/− organoids, 72 h postpassage. Data were analyzed with Student’s t test. Mean ± SD is shown with nonsignificance (ns) displayed. n = 5. (L) RT-qPCR for stated transcripts from Il18+/+ and Il18−/− organoids 72 h postpassage. Data were analyzed with Student’s t test. Mean ± SD is shown with **P ≤ 0.0and ***P ≤ 0.001 displayed. n = 8 from 4 biological repeats. (M) Representative immunoblot for IL-18 maturation in response to treatment with stated TLR ligands from Tlr5+/+ and Tlr5−/− ileal organoids for 24 h, n = 3. (N) RT-qPCR for stated transcripts from mature (72 h postpassage) Il18+/+ and Il18−/− ileal organoids treated with flagellin for 48 h. Two-way ANOVA with Tukey’s multiple comparisons test. Mean ± SD is shown with *P ≤ 0.05, **P ≤ 0.01, and nonsignificance (ns) displayed. n = 6 from 3 biological repeats. (O) Model. Abbreviations are as follows: ECC, PC, revival stem cell (revSC).

References

    1. Broz P., Dixit V. M., Inflammasomes: Mechanism of assembly, regulation and signalling. Nat. Rev. Immunol. 16, 407–420 (2016). - PubMed
    1. Kayagaki N., et al. , Caspase-11 cleaves gasdermin D for non-canonical inflammasome signalling. Nature 526, 666–671 (2015). - PubMed
    1. Lamkanfi M., Dixit V. M., Mechanisms and functions of inflammasomes. Cell 157, 1013–1022 (2014). - PubMed
    1. Shi J., et al. , Cleavage of GSDMD by inflammatory caspases determines pyroptotic cell death. Nature 526, 660–665 (2015). - PubMed
    1. Crowley S. M., et al. , Intestinal restriction of Salmonella Typhimurium requires caspase-1 and caspase-11 epithelial intrinsic inflammasomes. PLoS Pathog. 16, e1008498 (2020). - PMC - PubMed

MeSH terms

LinkOut - more resources