. 2025 May 27;18(888):eadu3794.
doi: 10.1126/scisignal.adu3794. Epub 2025 May 27.

YAP controls cell migration and invasion through a Rho GTPase switch

Affiliations

YAP controls cell migration and invasion through a Rho GTPase switch

Sagar R Shah et al. Sci Signal. .

Abstract

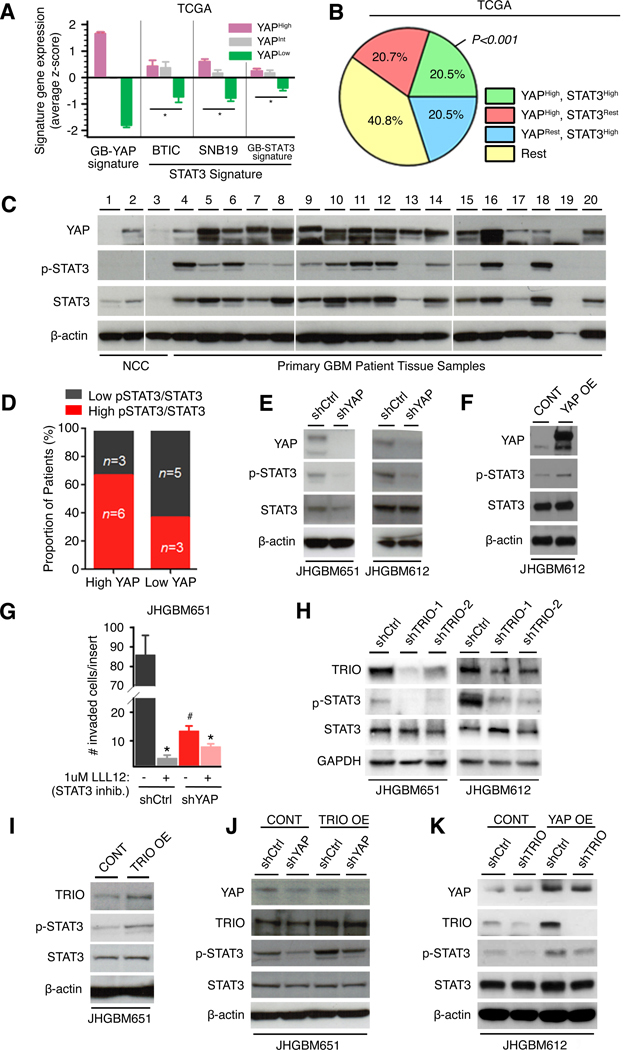
Delineating the mechanisms that control the movement of cells is central to understanding diverse physiological and pathophysiological processes. The transcriptional coactivator YAP is important during development and associated with cancer metastasis. Here, we found that YAP promoted cell migration by modulating a Rho family guanosine triphosphatase (GTPase) switch involving Rac1 and RhoA, which are key regulators of cytoskeletal dynamics. YAP transcriptionally transactivated the gene encoding the Rac1 guanine nucleotide exchange factor TRIO by directly binding to its intronic enhancer. This led to the activation of Rac1 and inhibition of RhoA, which increased cell migration and invasion in vitro and in vivo. This YAP-dependent program was observed across many cell types, including human breast epithelial cells and astrocytes, but it was particularly enhanced in a patient-specific manner in glioblastoma (GBM), the most common malignant brain tumor. Additionally, YAP-TRIO signaling activated STAT3, a transcription factor implicated in invasive growth in cancer, suggesting potential for cross-talk with this pathway to exacerbate invasive behavior. Clinically, hyperactivation of YAP, TRIO, and STAT3 gene signatures in GBM were associated with poor survival outcomes in patients. Our findings suggest that the YAP-TRIO-Rho-GTPase signaling network regulates invasive cell spread in both physiological and pathological contexts.


Conflict of interest statement

Competing interests: S.R.S. is an equity holder at OncoVisio, Inc., an equity holder and member of the scientific advisory board of NeuScience, Inc., and a consultant at Third Bridge Group Limited, which are not related to this work. The remaining authors declare no competing financial interests.

Figures

Figure 1:
Figure 1:. YAP regulates migratory capacity.
(A) Immunoblots of YAP protein level in lysates from human non-cancer cortex (N=7) and primary glioblastoma patient tissues (N=14). Blots are representative of 3 independent experiments using the same set of patient samples. (B) Migration pattern and average distance traveled by shCtrl or shYAP JHGBM651 cells in vitro on 2D surface. Trajectories are calculated from 20 cells each group and are representative of 3 independent experiments. (C and D) Mean migration speed of shCtrl versus shYAP JHGBM651 cells (C) or the empty backbone vector transduced cells (CONT) versus YAP-overexpressing (YAP OE) JHGBM612 cells (D). Mean migration speed is calculated from 30 cells in each group and are representative of 3 independent experiments. * P<0.05, Wilcoxon Rank-Sum test. (E) Left: Immunofluorescent staining for human-cell nuclei (HuNuc, red) with an all-nuclei counterstain (DAPI, blue) in mouse brain coronal sections after injection of shCtrl or shYAP JHGBM612 cells (i.s., injection site). Dashed lines outline the bulk tumor margins on the ipsilateral hemisphere. White boxes outline the area of the corpus callosum (c.c.) shown magnified in the right image. Scale bar, 1mm. m.l., midline; st, striatum; ctx, cortex; v, ventricle. Scale bar = 1mm. Images are representative of 5 mice per group. See also fig. S1P. (F) Mean number of shCtrl or shYAP cells invading past the midline into the contralateral hemisphere. Quantifications are per mouse and are pooled from 5 mice per group. Student’s t-test; * P<0.05. (G) Immunofluorescent images of paxillin (PAX, red), F-actin (Phalloidin, green), and cell nuclei (DAPI, blue) (left panel) and PAX only (right panel) in shCtrl and shYAP JHGBM651 cells, representative of 3 independent experiments. Scale bar, 5 μm. (H) Mean number of focal adhesions (FA) per cell in shCtrl (N=25 cells) and shYAP (N=16 cells) JHGBM651 cells. Results are representative of 3 independent experiments. * P<0.05, Student’s t-test. (I) Immunoblots of YAP and total and phosphorylated LIMK expression in shCtrl and shYAP JHGBM651 cells, representative of 3 independent experiments. Two independent shYAP constructs were used. In (C, D, F, and H), data are mean ± SEM.
Figure 2:
Figure 2:. YAP regulates migration through a Rho-GTPase switch.
(A) G-LISA analysis of RhoA-GTP levels in shCtrl or shYAP JHGBM651 cells pooled from 3 independent experiments. Student’s t-test: * P<0.05, between shCtrl and shYAP cells. (B) Mean migration speed of shCtrl or shYAP JHGBM651 cells treated with increasing doses (3, 10, 30 μM) of the ROCK inhibitor Y27632. Wilcoxon Rank-Sum test: red * P<0.05, shYAP + Y27632 (10 or 30 μM) vs no drug treatment; red # P<0.05, between shCtrl and shYAP cells at the corresponding dose. (C) G-LISA analysis of Rac1-GTP levels in shCtrl or shYAP JHGBM651 cells pooled from 3 independent experiments. Analyzed as in (A). (D) Mean migration speed of shCtrl or shYAP JHGBM651 cells treated with increasing doses of the Rac1-GEF inhibitor NSC23766. Wilcoxon Rank-Sum test; black * P<0.05, shCtrl + NSC23766 (250 or 500μM) vs shCtrl without drug; red # P<0.05, shCtrl vs shYAP cells of the indicated condition. (E) Mean migration speed of shCtrl and shYAP JHGBM651 cells that were unperturbed (“No drug”, first graph) or treated with 10 μM Y27632 or 250μM NSC23766 for 3 or 6 hours as indicated. Wilcoxon Rank-Sum test: black * P<0.05, hours 1 to 2 vs hours 4 to 5 in shCtrl cells and in shYAP cells (black and red asterisks with P values, respectively); red # P<0.05, shYAP cells vs shCtrl cells at the marked time points. (F) G-LISA analysis of Rac1-GTP levels in shCtrl and shYAP JHGBM651 cells treated with vehicle or 30 μM Y27632. Results are pooled from 3 independent experiments. Student’s t-test: * P<0.05, between drug and no drug treatment in shCtrl or shYAP cells; # P<0.05, between shYAP and shCtrl cells with no drug treatment. (G) G-LISA analysis of RhoA-GTP levels in shCtrl or shYAP JHGBM651 cells treated with vehicle or 250 μM NSC23766. Results are pooled from 3 independent experiments. Analyzed as in (F). (H) Immunoblot of YAP and RhoA expression in shCtrl or shYAP JHGBM651 cells transfected with siCtrl or siRhoA, representative of 3 independent experiments. (I) Mean migration speed of shCtrl or shYAP JHGBM651 cells transfected with siCtrl or siRhoA. Wilcoxon Rank-Sum test: * P<0.05, between conditions in shYAP cells; # P<0.05, between the siCtrl conditions. (J) Mean migration speed of shCtrl or shYAP GBMA172 cells transfected with the empty backbone vector (pCtrl) or a dominant-negative RhoA vector (pRhoA-DN). Wilcoxon Rank-Sum test; * P<0.05, between pRhoA-DN and pCtrl in shYAP cells; # P<0.05, between pCtrl in shYAP and that in shCtrl cells. (K) Mean migration speed of shCtrl and shYAP GBMA172 cells transfected with the empty backbone vector (pCtrl) or a constitutively active Rac1 vector (pRac1-CA). Wilcoxon Rank-Sum test: * P<0.05, between the conditions in shYAP cells; # P<0.05, between the pCtrl conditions. In (B, D, E, and I to K), mean migration speed is calculated from 30 cells and the result is representative from 3 independent experiments. In (A to G, and I to K), the data are mean ± SEM.
Figure 3:
Figure 3:. YAP directly transactivates the Rac1-GEF TRIO.
(A) Immunoblot of TRIO protein level in shCtrl or shYAP JHGBM651/JHGBM612 cells, representative of 3 independent experiments. (B) TRIO mRNA expression in shCtrl or shYAP JHGBM651/JHGBM612 cells. Results are pooled from 3 independent experiments. Student’s t-test: * P<0.05. (C) Immunoblot of TRIO protein level in the empty backbone vector transduced cells (CONT) or YAP OE JHGBM612 cells, representative of 3 independent experiments. (D) YAP/TEAD4 binding to an intronic region of TRIO as observed in a publicly available ChIP-sequencing dataset using MDA-MD-231 cells (33). (E) ChIP-PCR querying across two enhancer elements of TRIO in JHGBM612 cells. Results are representative of 3 independent experiments. (F) TRIO gene enhancer luciferase assay using TRIO enhancer segment in cells with or without YAP OE in JHGBM612 cells. Student’s t-test: * P<0.05. (G to I) G-LISA analysis of Rac1-GTP levels in the empty backbone vector-transduced cells (CONT) and either YAP OE (G) or TRIO OE (H) JHGBM612 cells, and in shCtrl and shTRIO JHGBM651 cells (I), each from 3 independent experiments. Student’s t-test: * P<0.05. (J) Correlation plot of relative YAP and TRIO protein levels (normalized to β-actin) in patient-derived primary GBM tissues resulting from densitometric analysis of immunoblots described in Fig. 6C and fig. S5T. (K) TRIO and TIAM1 expression in patient tumors grouped by high, intermediate, or low YAP expression in the REMBRANDT GBM dataset. Student’s t-test: * P<0.05. (L) Percentage of patients with enriched GB-YAP signature, high expression of TRIO transcript, or both in the REMBRANDT GBM dataset. P calculated by Fisher’s exact test vs other patient groups. In (B, F to I, and K), data are mean ± SEM.
Figure 4:
Figure 4:. YAP-TRIO signaling regulates migration.
(A) A representative immunoblot of TRIO protein levels in shCtrl and shTRIO JHGBM651 cells with two independent shTRIO constructs from 3 independent experiments. (B) Mean migration speed of shCtrl or shTRIO JHGBM651 cells. Wilcoxon Rank-Sum test: * P<0.05. (C) A representative immunoblot of TRIO and YAP protein levels in the empty backbone vector transduced cells (CONT) and TRIO OE JHGBM651 cells from 3 independent experiments. (D) Mean migration speed of the empty backbone vector transduced cells (CONT) and TRIO OE JHGBM651 cells. Wilcoxon Rank-Sum test: * P<0.05. (E) Mean migration speed of shCtrl, shYAP, and shYAP+TRIO OE JHGBM651 cells. Wilcoxon Rank-Sum test: * P<0.05 vs shCtrl. (F) Immunoblot of GFP and TRIO protein levels in the empty backbone transduced cells (CONT), TRIO–wild-type OE, TRIO-iGEF1 OE, and TRIO-iGEF2 OE JHGBM612 cells, representative of 3 independent experiments. (G) Mean migration speed of the empty backbone vector transduced cells (CONT), TRIO OE (wild-type TRIO), TRIO iGEF1 OE, and TRIO iGEF2 OE JHGBM612 cells. Wilcoxon Rank-Sum test: * P<0.05 vs CONT. In (B, D, E, and G), mean migration speed is calculated from 30 cells and results are representative from 3 independent experiments. Data are mean ± SEM.
Figure 5:
Figure 5:. YAP-TRIO signaling promotes cell invasion.
(A) GB-YAP and Invasive gene signature expression in YAP high, intermediate, or low patient groups in the TCGA GBM dataset. Student’s t-test: * P<0.05. (B and C) Matrigel Boyden invasion assay of shCtrl or shYAP JHGBM651 and the empty backbone vector transduced cells (CONT) or YAP OE JHGBM612 cells, respectively, from 3 independent experiments. Student’s t-test: * P<0.05. (D) Matrigel Boyden invasion assay of shCtrl, shYAP, or shTRIO JHGBM651 and JHGBM612 cells from 3 independent experiments. Student’s t-test: * P<0.05. (E) Matrigel Boyden invasion assay of the empty backbone vector transduced cells (CONT) and TRIO OE JHGBM651 cells from 3 independent experiments. Student’s t-test; * P<0.05. (F) Left: Staining for human nuclei and DAPI in mouse brain coronal sections after injections of the empty backbone vector transduced cells (CONT) + shCtrl, CONT + shTRIO, YAP OE shCtrl, or YAP OE + shTRIO JHGBM612 cells (i.s., injection site). Bulk tumor margins are indicated on the ipsilateral hemisphere. White boxes in the left images (scale bars, 1 mm) outline the area of the corpus callosum (c.c.) in each that is magnified in the right images (scale bars, 500 μm). m.l., midline; st, striatum; ctx, cortex; v, ventricle). Images are representative of 5 mice per group. (G) Mean number of the empty backbone vector transduced cells (CONT) + shCtrl, CONT + shTRIO, YAP OE + shCtrl, or YAP OE + shTRIO cells invading through the corpus callosum into the contralateral hemisphere. Quantifications are per mouse from 5 mice per group. Student’s t-test: * and # P<0.05 vs shCtrl-CONT cells. In (A to E, and G), data shown are mean ± SEM.
Figure 6:
Figure 6:. STAT3 is potentially involved in YAP-mediated cell invasion.
(A) Expression of STAT3 signatures in YAP high, intermediate, or low patient samples in the TCGA GBM dataset. GB-STAT3 signature was derived from conserved STAT3 signatures observed in both BTIC or SNB19 GBM cell lines; Student’s t-test: * P<0.05. (B) Percentage of patients with an enriched GB-YAP signature, GB-STAT3 signature, or both in the REMBRANDT GBM dataset. P calculated by Fisher’s exact test vs other patient groups. (C) immunoblots of YAP and total and phosphorylated (at Tyr705) STAT3 protein levels in tissue homogenates of non-cancer cortices (NCC) and primary glioblastoma specimen, representative of 3 independent experiments using the same set of patient samples. (D) Percentage of GBM patients with high (N=9) or low (N=8) YAP protein level that had a high or low Tyr705-phsophorylated-to-total STAT3 protein ratio, quantified from immunoblotting analysis described in (C). (E and F) Immunoblots of YAP and total and phospho-Tyr705 STAT3 abundance in shCtrl or shYAP JHGBM651 and JHGBM612 and CONT or YAP OE JHGBM612 cells, respectively. Results are representative of 3 independent experiments. (G) Matrigel Boyden invasion assay of shCtrl and shYAP JHGBM651 cells treated with vehicle or the STAT3 inhibitor LLL12 (1 μM). Results are pooled from 3 independent experiments. Student’s t-test: * P<0.05 vs the corresponding no drug (–) treatment; # P<0.05 vs shCtrl without drug. (H) Immunoblot of total and phospho-Tyr705 STAT3 protein levels in shCtrl and shTRIO-1 JHGBM651 and JHGBM612 cells, representative of 3 independent experiments each using two independent shTRIO constructs. (I) Immunoblot of total and phospho-Tyr705 STAT3 expression in CONT and TRIO OE JHGBM651 cells, representative of 3 independent experiments. (J) Immunoblot of total and phospho-Tyr705 STAT3 protein levels in shCtrl and shYAP JHGBM651 cells with or without TRIO overexpression, representative of 3 independent experiments. (K) Immunoblot of total and phospho-Tyr705 STAT3 protein levels in shCtrl and shTRIO JHGB612 cells with or without YAP overexpression, representative of 3 independent experiments. In (A and G), data are mean ± SEM.
Figure 7:
Figure 7:. YAP, TRIO, and STAT3 signaling predict poor clinical outcomes in glioblastoma.
(A) Percentage of patients with an enriched GB-YAP signature expression, grouped by glioma grade, from the REMBRANDT and TCGA datasets. N = 99 grade 2 REM., 84 grade 3 REM., 226 grade 4 REM., and 301 grade 4 TCGA. (B) Kaplan-Meier graph of cumulative progression-free survival in patient groups defined by GB-YAP signature expression in TCGA dataset. P calculated by Log-Rank test. (C) Percentage of GBM patients with an enriched GB-YAP signature expression, grouped by subtype, from the TCGA. P calculated by Fisher’s exact test; n as noted. (D) Expression of GBM YAP high, intermediate, and low patient samples in subclass signatures from the TCGA dataset (as derived from TCGA “Core” samples). Classic., classical; Mes., mesenchymal; Proneur., proneural. Data are mean ± SEM. Student’s t-test: * P<0.05, between YAPHigh and YAPLow within the mesenchymal subset. (E) mRNA expression of “Mesenchymal” GBM subclass signature genes in shCtrl or shYAP JHGB651, JHGB640, and JHGB612 cells. Data are mean ± SEM. Student’s t-test: * P<0.05 vs corresponding shCtrl. (F) Distribution of patients expressing either one, two, or all three of the GB-YAP signature, TRIO transcripts, and GB-STAT3 signature expression patterns. (G to I) Kaplan-Meier graphs of cumulative progression-free survival in patient groups defined by the GB-YAP signature, TRIO transcript expression, and GB-STAT3 signature expression in the TCGA dataset. The triple-low group (yellow) is the same in each panel for comparison. P calculated by Log-Rank test. (J) Schematic of the YAP-driven pro-migratory and invasive signaling pathway in a single cell on a layer of extracellular matrix. Thick red and purple arrows denote movement of the cell body during migration and invasion, respectively. Darker shading of the extracellular matrix around the invading edge of the cell represents the degradation of the surrounding tissue.

References

    1. Sahai E, Marshall CJ, RHO-GTPases and cancer. Nat Rev Cancer 2, 133–142 (2002). - PubMed
    1. Calvo F, Ege N, Grande-Garcia A, Hooper S, Jenkins RP, Chaudhry SI, Harrington K, Williamson P, Moeendarbary E, Charras G, Sahai E, Mechanotransduction and YAP-dependent matrix remodelling is required for the generation and maintenance of cancer-associated fibroblasts. Nat Cell Biol 15, 637–646 (2013). - PMC - PubMed
    1. Chen D, Sun Y, Wei Y, Zhang P, Rezaeian AH, Teruya-Feldstein J, Gupta S, Liang H, Lin H-K, Hung M-C, Ma L, LIFR is a breast cancer metastasis suppressor upstream of the Hippo-YAP pathway and a prognostic marker. Nat Med 18, 1511–1517 (2012). - PMC - PubMed
    1. Dong J, Feldmann G, Huang J, Wu S, Zhang N, Comerford SA, Gayyed MF, Anders RA, Maitra A, Pan D, Elucidation of a universal size-control mechanism in Drosophila and mammals. Cell 130, 1120–1133 (2007). - PMC - PubMed
    1. Dupont S, Morsut L, Aragona M, Enzo E, Giulitti S, Cordenonsi M, Zanconato F, Le Digabel J, Forcato M, Bicciato S, Elvassore N, Piccolo S, Role of YAP/TAZ in mechanotransduction. Nature 474, 179–183 (2011). - PubMed

MeSH terms