. 2025 Jul:84:103677.
doi: 10.1016/j.redox.2025.103677. Epub 2025 May 13.

Disulfide-mediated tetramerization of TRAP1 fosters its antioxidant and pro-neoplastic activities

Affiliations

Disulfide-mediated tetramerization of TRAP1 fosters its antioxidant and pro-neoplastic activities

Fiorella Faienza et al. Redox Biol. 2025 Jul.

Abstract

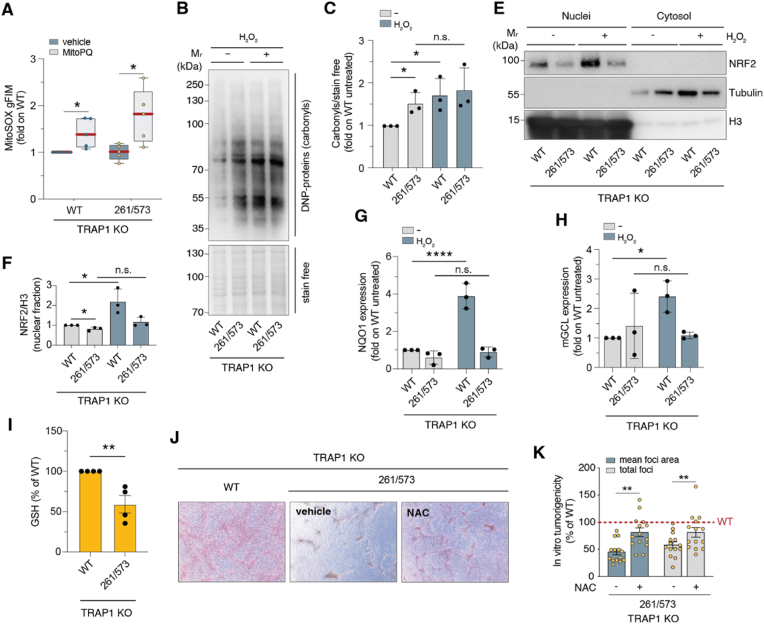
The mitochondrial chaperone TRAP1 exerts protective functions under diverse stress conditions. It induces metabolic rewiring and safeguards cancer cells from oxidative insults, thereby contributing to neoplastic progression. TRAP1 works as a homodimer, but recent evidence indicated that it forms tetramers whose effects remain elusive. Here, we find that TRAP1 generates redox-sensitive tetramers via disulfide bonds involving cysteines 261 and 573. TRAP1 tetramerization is elicited by oxidative stress and abrogated upon expression of the double C261S/C573R mutant. In cancer cells, the TRAP1 C261S/C573R mutant is unable to inhibit the activity of its client succinate dehydrogenase and to confer protection against oxidative insults, thus hampering the invasiveness of aggressive sarcoma cells. Overall, our findings indicate that TRAP1 undergoes tetramerization in response to oxidative stress and identify C261 and C573 as critical for TRAP1 structural rearrangement and functions.

Keywords: Cysteine; Metabolism; Mitochondria; Oxidative stress; Tumorigenesis.


Conflict of interest statement

Declaration of competing interest The authors declare that they have no known competing financial interests or personal relationships that could have appeared to influence the work reported in this paper.

Figures

Image 1
Graphical abstract
Fig. 1
Fig. 1
TRAP1 forms redox-sensitive tetramers. A.Wild type (WT) recombinant human TRAP1 exposed to 100 μM H2O2 and/or 10 mM DTT for 30 min and analyzed by non-reducing or reducing SDS-PAGE (top). Densitometric analyses of n = 10 independent experiments (p = 0.042). Data are expressed as mean ± S.D. Paired t-test was applied for statistical analyses (bottom). B. WT TRAP1 incubated with increasing concentrations of H2O2 (from 1 nM to 100 μM). C-E. WT and different Cys-mutant treated as in A. Gels were reduced to show only the high-molecular-weight (HMW) form of TRAP1 (above 170 kDa) and the monomeric TRAP1 (∼80 kDa). An horizontal dotted line stands for this digital cut. F. Gel-filtration chromatograms of recombinant TRAP1 (WT and C261S/C573R double mutant) exposed to 100 μM H2O2 or 10 mM DTT for 30 min. Fraction #12 refers to tetrameric TRAP1. Fraction #16 refers to dimeric TRAP1. G, H. Representative SDS-PAGE and band densitometry of fractions obtained by gel-filtration chromatography shown in E.
Fig. 2
Fig. 2
Molecular modeling of TRAP1 tetrameric structures. Structural models of the parallel (A) and anti-parallel conformation (B) of TRAP1 tetramers. Insets: magnification of C261- and C573-containing regions.
Fig. 3
Fig. 3
TRAP1 forms tetramers in cells in response to oxidative stress. A. Non-reducing Western blot of TRAP1 in mitochondrial extracts of A375 cells treated with 100 μM H2O2 for 30 min, 1 mM diamide (Dia) for 30 min, or 10 μM oligomycin (OM) for 4 h. Citrate synthase (CS) was used as loading control. DTT was used where indicated to reduce disulfides. HMW TRAP1:high-molecular-weight TRAP1. B, C. Non-reducing Western blot of TRAP1 in TRAP1-silenced (shTRAP1) HeLa cells expressing either WT or C261S/C573R HA-linked TRAP1 treated with (B) 100 μM H2O2 or 10 μM cisplatin (CDDP), or (C) 100 μM BSO or 10 mM NAC for 24 h. HMW TRAP1:TRAP1 ratio is shown of the right. Data are expressed as densitometry relative to untreated WT cells and represent the mean ± S.D. t-test applied for statistical analysis (∗, p < 0.05). D. (top) Non-reducing Western blot of TRAP1 in TRAP1-silenced (shTRAP1) HeLa cells reconstituted with a WT HA-linked TRAP1. Cells were concomitantly transfected with an empty vector, SOD2, or a mitochondria-targeted catalase (M-CAT) and treated with 100 μM H2O2 for 10 min (bottom) HMW TRAP1:TRAP1 ratio. Data are expressed as densitometry relative to untreated WT cells and represent the mean ± S.D. t-test applied for statistical analysis (∗, p < 0.05; n.s., non significant). E. Non-reducing Western blot analysis of TRAP1 in mitochondrial extracts of H2O2-treated sMPNST cells (top). DTT was used where indicated to reduce disulfides. HMW TRAP1 was normalized on citrate synthase (CS) (bottom). (n = 3; ∗, p < 0.05). Data are expressed as mean ± S.D. t-test was applied for statistical analyses. The vertical dotted line indicates that, while the immunoreactive bands were part of the same Western blot, they were not adjacent on the gel. F. Non-reducing Western blot analysis of TRAP1 in cell extracts of H2O2-treated sMPNST cells exposed to hypoxia for 2 h followed by reoxygenation for 10 min (H/R). DTT was used where indicated to reduce disulfides. G. Generation of TRAP1-KO sMPNST cells reconstituted with HA-TRAP1 wild-type, C261S/C573R mutant, or an empty vector (top). Western blot analysis to verify ectopic expression of TRAP1 (bottom). Citrate synthase (CS) was used as loading control. H, I. Non-reducing Western blot analysis of TRAP1 in mitochondrial extracts of sMPNST cells reconstituted as in D (E) and treated with 1 mM diamide (Dia) or 100 μM H2O2 for 30 min (F). Citrate synthase (CS) was used as loading control. DTT was used where indicated to reduce disulfides. The vertical dotted line indicates that, while the immunoreactive bands were part of the same Western blot, they were not adjacent on the gel. Where present, the whole Western blots were reduced in size to show only the high-molecular-weight (HMW) form of TRAP1 and the monomeric TRAP1. A horizontal dotted line stands for this digital cut.
Fig. 4
Fig. 4
TRAP1 tetramerization contributes to tumor cell aggressiveness. A. TRAP1-KO sMPNST cells transfected with HA-TRAP1 wild-type, C261S/C573R mutant, or an empty vector were used to assess succinate dehydrogenase (SDH) activity (n = 5; ∗∗, p < 0.01; ∗∗∗∗, p < 0.0001; n.s., non significant) B. Proliferation rate of TRAP1-KO sMPNST cells reconstituted as in A (n = 3; n.s., non significant). Data are expressed as mean ± S.D. Two-way ANOVA was applied for all statistical analyses, unless otherwise indicated. C. Representative images of tumor foci, spheroids and invasive masses of TRAP1-KO sMPNST cells reconstituted as in A. Scale bar = 100 μM. D. ImageJ evaluation of total foci (n = 5; ∗∗∗∗, p < 0.0001); foci area (n = 5; ∗∗∗∗, p < 0.0001); spheroid size (n = 30; ∗∗∗∗, p < 0.0001), and invasive area (n = 4; ∗∗∗, p < 0.001). E. TRAP1-KO sMPNST cells transfected with HA-TRAP1 wild-type, C261S/C573R mutant, or an empty vector were used to assess spheroid area upon treatment with 2 mM dimethyl succinate (DMS) for 10 days (n = 25; ∗, p < 0.05; n.s., non significant — t-test analysis). F. (left) Representative images of tumor spheroids of Neurofibromin 1-deficent (Nf1−/−) mouse embryonic fibroblasts (MEFs) reconstituted as in C. (right) ImageJ evaluation of spheroid size (n = 21; ∗∗∗∗, p < 0.0001) was expressed as fold change on WT. Scale bar = 100 μM.
Fig. 5
Fig. 5
A. TRAP1 tetramerization contributes to the anti-oxidant response of tumor cells. TRAP1-KO sMPNST cells transfected with HA-TRAP1 wild-type or C261S/C573R mutant were used for MitoSOX evaluation of ROS levels upon treatment with 1 μM mito-paraquat (mito-PQ) for 2 h (n = 5; ∗, p < 0.05 — t-test analysis). B. Western blot of protein carbonyls evaluated in cells as in A. exposed to 400 μM H2O2 overnight. Lysates were derivatized with dinitrophenylhydrazine (DNP) to detect carbonyl groups on proteins. Stain free was used as loading control. C. Densitometry of B. Data are relativized to stain free and expressed as fold on WT untreated cells, and represent the mean ± S.D. t-test applied for statistical analysis (n = 3; ∗, p < 0.05; n.s., non significant). D. Western blot analyses of NRF2 in nuclear and cytosolic fractions of TRAP1-KO sMPNST cells transfected with HA-TRAP1 wild-type or C261S/C573R mutant and treated with 400 μM H2O2 overnight. Tubulin and histone H3 were used as fraction purity controls of the cytosol and nuclei, respectively. E. Densitometric analyses of nuclear NRF2 assessed in E. Data expressed as NRF2/H3 and represent the mean ± S.D. t-test applied for statistical analysis (n = 3; ∗, p < 0.05; n.s., non significant). F, G. qRT-PCR analyses of mRNA expression of (F) NAD(P)H:quinone oxidoreductase 1 (NQO1) and (G) the modulator subunit of glutamate-cysteine ligase (mGCL). Data expressed as fold change on WT untreated, and represent the mean ± S.D. t-test applied for statistical analysis (n = 3; ∗, p < 0.05; ∗∗∗∗, p < 0.0001; n.s., non significant). H. Intracellular glutathione (GSH) levels evaluated in TRAP1-KO sMPNST cells transfected with HA-TRAP1 wild-type (WT) or C261S/C573R mutant. Data expressed as % of WT and represent the mean ± S.D. t-test applied for statistical analysis (n = 3; ∗, p < 0.05; ∗∗∗∗, p < 0.0001; n.s., non significant). I. Representative images of tumor foci of TRAP1-KO sMPNST cells reconstituted as in A, treated with 5 mM N-acetyl-l-cysteine (NAC) every 2 days for 10 days. J. ImageJ evaluation of total foci (n = 14; ∗∗, p < 0.01), foci area (n = 14; ∗∗, p < 0.01). Data are expressed as mean ± S.D. Two-way ANOVA was applied for all statistical analyses, unless otherwise indicated.

References

    1. Masgras I., et al. The molecular chaperone TRAP1 in cancer: from the basics of biology to pharmacological targeting. Semin. Cancer Biol. 2021;76:45–53. - PubMed
    1. Rasola A., Neckers L., Picard D. Mitochondrial oxidative phosphorylation TRAP(1)ped in tumor cells. Trends Cell Biol. 2014;24:455–463. - PMC - PubMed
    1. Laquatra C., et al. HIF1α-dependent induction of the mitochondrial chaperone TRAP1 regulates bioenergetic adaptations to hypoxia. Cell Death Dis. 2021;12 - PMC - PubMed
    1. Zhang B., et al. Aberrantly upregulated TRAP1 is required for tumorigenesis of breast cancer. Oncotarget. 2015;6 - PMC - PubMed
    1. Xu L., Voloboueva L.A., Ouyang Y.B., Emery J.F., Giffard R.G. Overexpression of mitochondrial Hsp70/Hsp75 in rat brain protects mitochondria, reduces oxidative stress, and protects from focal ischemia. J. Cerebr. Blood Flow Metabol. 2009;29:365–374. - PMC - PubMed

LinkOut - more resources