. 2025 Jun 25;45(26):e0226242025.
doi: 10.1523/JNEUROSCI.0226-24.2025.

Distinct Regulation of Early Trafficking of the NMDA Receptors by the Ligand-Binding Domains of the GluN1 and GluN2A Subunits

Affiliations

Distinct Regulation of Early Trafficking of the NMDA Receptors by the Ligand-Binding Domains of the GluN1 and GluN2A Subunits

Jakub Netolicky et al. J Neurosci. .

Abstract

N-Methyl-d-aspartate receptors (NMDARs) play a crucial role in excitatory neurotransmission, with numerous pathogenic variants identified in the GluN subunits, including their ligand-binding domains (LBDs). The prevailing hypothesis postulates that the endoplasmic reticulum (ER) quality control machinery verifies the agonist occupancy of NMDARs, but this was tested in a limited number of studies. Using microscopy and electrophysiology in the human embryonic kidney 293 (HEK293) cells, we found that surface expression of GluN1/GluN2A receptors containing a set of alanine substitutions within the LBDs correlated with the measured EC50 values for glycine (GluN1 subunit mutations) while not correlating with the measured EC50 values for l-glutamate (GluN2A subunit mutations). The mutant cycle of GluN1-S688 residue, including the pathogenic GluN1-S688Y and GluN1-S688P variants, showed a correlation between relative surface expression of the GluN1/GluN2A receptors and the measured EC50 values for glycine, as well as with the calculated ΔG binding values for glycine obtained from molecular dynamics simulations. In contrast, the mutant cycle of GluN2A-S511 residue did not show any correlation between the relative surface expression of the GluN1/GluN2A receptors and the measured EC50 values for l-glutamate or calculated ΔG binding values for l-glutamate. Coexpression of both mutated GluN1 and GluN2A subunits led to additive or synergistic alterations in the surface number of GluN1/GluN2A receptors. The synchronized ER release by ARIAD technology confirmed the altered early trafficking of GluN1/GluN2A receptors containing the mutated LBDs. The microscopical analysis from embryonal rat hippocampal neurons (both sexes) corroborated our conclusions from the HEK293 cells.

Keywords: Golgi apparatus; endoplasmic reticulum; glutamate receptor; hippocampal neuron; ion channel; pathogenic variant.


Conflict of interest statement

The authors declare no competing financial interests.

Figures

Figure 1.
Figure 1.
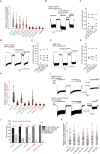
Mutations of residues in the LBD of the GluN1 subunit that interact with glycine affect surface expression and glycine potency of GluN1/GluN2A receptors. A, The structural model of the NMDAR comprises GluN1 (depicted in green) and GluN2A (depicted in red) subunits (based on PDB ID: 7EU7). B, The structural model of the LBD of GluN1 subunit with labeled glycine-interacting amino acids (based on PDB ID, 1PB7). C, Representative images of HEK293 cells transfected with either the YFP-GluN1-1a subunit (WT or mutant variant) alone (negative control) or with the GluN2A subunit. The total and surface signals (top and bottom row, respectively) of YFP-GluN1-1a subunits were labeled using an anti-GFP antibody 24 h after the transfection. D, H, Summary of the relative surface expression of NMDARs consisting of either WT or mutated YFP-GluN1-1a subunit coexpressed with the GluN2A subunit (D) and WT or mutated GluN1-4a subunit coexpressed with the GFP-GluN2A subunit (H), measured using fluorescence microscopy; *p < 0.05; **p < 0.010; and ***p < 0.001 versus WT; one-way ANOVA. Data points correspond to individual cells (n ≥ 56), and the red box plot indicates mean ± SEM. E, Representative whole-cell patch–clamp recordings of HEK293 cells expressing the indicated GluN subunits. Glycine (gly) at the indicated concentrations was applied in the continuous presence of 300 µM l-glutamate (l-glu). F, I, Normalized concentration–response curves for glycine measured from HEK293 cells expressing NMDARs containing YFP-GluN1-1a (F) or GluN1-4a subunit variants (I) coexpressed with the GluN2A subunit were obtained by fitting the data using Equation 1 (see Materials and Methods); for the summary of fitting parameters, see Table 1. G, J, Correlation of surface expression and glycine EC50 values at NMDARs composed of WT or mutated YFP-GluN1-1a subunit (G) and WT or mutated GluN1-4a (J) subunit expressed together with GFP-GluN2A subunit; data were fitted by linear regression.
Figure 2.
Figure 2.
Mutations of residues in LBD of GluN2A subunit interacting with l-glutamate affect surface expression and l-glutamate potency of GluN1/GluN2A receptors. A, The structural model of the LBD of the GluN2A subunit labeled with l-glutamate–interacting amino acids (based on PDB ID, 5I57). B, Representative images of HEK293 cells cotransfected with WT GluN1-4a and WT or mutated GFP-GluN2A subunits. The total and surface signals (top and bottom row, respectively) of GFP-GluN2A subunits were labeled using an anti-GFP antibody 24 h after the transfection. C, Summary of the relative surface expression of NMDARs consisting of either WT or mutated GFP-GluN2A subunit together with WT GluN1-4a subunit, measured using fluorescence microscopy; *p < 0.050 and ***p < 0.001 versus WT; one-way ANOVA. Data points correspond to individual cells (n ≥ 136), and the red box plot indicates mean ± SEM. D, Representative whole-cell voltage–clamp recordings of HEK293 cells transfected with the indicated NMDAR subunits. l-Glutamate (l-glu) at the indicated concentrations was applied in the continuous presence of 100 µM glycine (gly). E, Normalized concentration–response curves for l-glutamate measured from HEK293 cells expressing NMDARs containing WT or mutated GluN1-4a/GFP-GluN2A receptors were obtained by fitting the data using Equation 1 (see Materials and Methods); for the summary of fitting parameters, see Table 2. F, Correlation of surface expression and EC50 values for l-glutamate at NMDARs composed of WT or mutated GluN1-4a/GFP-GluN2A receptors; data were fitted by linear regression.
Figure 3.
Figure 3.
Alanine substitutions in the LBDs of both GluN1 and GluN2A subunits alter the early trafficking of NMDARs. A, Schematic representation of ARIAD-mNEON-GluN1-1a construct with a signal sequence (gray), conditional aggregation domain (orange), furin cleavage site (blue), mNEONGreen [green; mNEON sequence was inserted after the 21st amino acid residue of the GluN1-1a subunit (red)]. Upon the addition of the AL to the cells, AL binds to the conditional aggregation domain, leading to a conformational change and release of the ARIAD-mNEON-GluN1-1a construct from the ER, followed by cleavage of the ARIAD sequence by the protease furin. See also the Materials and Methods section. B, Representative images of HEK293 cells expressing ARIAD-mNEON-GluN1-1a construct either alone or with the GluN2A subunit at 0 min (without AL) and 60 min after adding AL. The total and surface signals (top and bottom row, respectively) of ARIAD-mNEON-GluN1-1a constructs were labeled using an anti-mNEONGreen antibody 24 h after the transfection. The representative images of GluN1-4a/ARIAD-mNEON-GluN2A receptor are shown in Figure S1. C, Summary of relative surface expression of NMDARs containing WT or mutated ARIAD-mNEON-GluN1-1a constructs together with GluN2A subunit in the absence or presence (60 min) of AL, measured using fluorescence microscopy; ***p < 0.001 for differences between ARIAD-mNEON-GluN1-1a/GluN2A in the presence of AL and ARIAD-mNEON-GluN1-1a expressed alone; +++p < 0.001 for differences between presence and absence of AL; two-way ANOVA. Data points correspond to individual cells (n ≥ 26), and the red box plot indicates mean ± SEM. See Figure S2, A and B, for a summary of the relative surface expression of the time points for the ARIAD-mNEON-GluN1-1a construct coexpressed with GluN2A or GluN3A subunits. D, Representative microscopy images of the HEK293 cells cotransfected with ARIAD-mNEON-GluN1-1a construct and GluN2A or GluN3A subunits in the absence or presence (30 min) of AL; the anti-GM130 antibody was used to label the GA. E, Summary of the average intensity of ARIAD-mNEON-GluN1-1a subunit signal colocalized with GM130 over the average intensity of ARIAD-mNEON-GluN1-1a subunit signal outside the GM130 signal, calculated for the indicated NMDAR combinations; ***p < 0.001 for differences between ARIAD-mNEON-GluN1-1a/GluN3A receptors in the presence of AL and ARIAD-mNEON-GluN1-1a/GluN2A receptors; ++p < 0.01 for differences between the presence and absence of AL; two-way ANOVA. Data points correspond to individual cells (n ≥ 18), and the red box plot indicates mean ± SEM. See Figure S3 for a summary of the time points for colocalized ARIAD-mNEON-GluN1-1a construct coexpressed with GluN2A subunits. F, G, Summary of relative surface expression of NMDARs containing WT or mutated ARIAD-mNEON-GluN1-1a subunits coexpressed with WT GluN2A subunit (F) or WT ARIAD-mNEON-GluN1-1a subunit coexpressed with WT or mutated GluN2A subunit (G), measured in the absence or presence (60 min) of AL, using fluorescence microscopy; **p < 0.010 and ***p < 0.001 for differences between WT and mutated ARIAD-mNEON-GluN1-1a/GluN2A receptors in the presence of AL; +++p < 0.001 for differences between the absence and presence of AL; two-way ANOVA. Data points correspond to individual cells (n ≥ 55), and the red box plot indicates mean ± SEM. Different internalization rates did not affect the surface expression of GluN1/GluN2A-S511A receptors; see representative images of internalization assay with WT GluN1-4a/GFP-GluN2A and GluN1-4a/GFP-GluN2A-S511A receptors (Fig. S4A) and the subsequent quantification of surface and internalized GFP signals (Fig. S4B).
Figure 4.
Figure 4.
Alanine substitutions in the LBDs of GluN1 and GluN2A subunits additively or synergically regulate the early trafficking of GluN1/GluN2A receptors. A, Summary of the relative surface expression of NMDARs containing mutations within LBDs of both GluN1-4a and GFP-GluN2A subunits, measured using fluorescence microscopy; **p < 0.01 and ***p < 0.001 versus WT; one-way ANOVA. Data points correspond to individual cells (n ≥ 55), and the red box plot indicates mean ± SEM. B, D, F, Representative whole-cell patch–clamp recordings of GluN1-4a-N499C-Q686C/GFP-GluN2A-K487C-N687C (B), GluN1-4a-N499C-Q686C/GFP-GluN2A (D), and GluN1-4a/GFP-GluN2A-K487C-N687C (F) receptors expressed in the HEK293 cells. The current responses were elicited under the specified conditions. ECS denotes Mg2+-free extracellular solution, l-glu represents l-glutamate (1 mM), and gly indicates glycine (1 mM). As indicated, 10 µM 5,7-DCKA and 50 µM D-APV were applied. C, E, G, Comparison of current response amplitudes evoked by ECS without Mg2+ (C), 1 mM l-glutamate plus 10 µM DCKA (E), and 1 mM glycine plus 50 µM D-APV (G). H, Summary of relative surface expression for NMDARs composed of GluN1-4a and GFP-GluN2A subunits with the closed-cleft (CC) conformation of LBDs in combination with selected alanine substitutions, measured using fluorescence microscopy; ***p < 0.001 versus WT; one-way ANOVA. Data points correspond to individual cells (n ≥ 54), and the red box plot indicates mean ± SEM. I, Representative whole-cell patch–clamp recordings from the HEK293 cells expressing the indicated GluN subunits. Glycine (gly) and/or l-glutamate (l-glu) were applied as indicated at a concentration of 1, and 50 mM BME was applied 1 min before the second application of gly or l-glu. J, Summary of the electrophysiological data analysis shown in I; the graph shows the percentage change of the peak current amplitudes induced by indicated combinations of (co-)agonists before and after BME treatment; CC indicates the closed-cleft configuration of GluN1-4a or GluN2A subunits; ***p < 0.001 versus the current response after BME treatment; two-way ANOVA. K, Summary of the effect of indicated competitive antagonists on surface expression of WT GluN1-4a/GFP-GluN2A receptors, measured using fluorescence microscopy; p > 0.05; one-way ANOVA. The abbreviations are as follows: L-689,560, 4-trans-2-carboxy-5,7-dichloro-4-phenylaminocarbonylamino-1,2,3,4-tetrahydroquinoline; L-701,324, 7-chloro-4-hydroxy-3-(3-phenoxy)phenyl-2(1H)-quinolone; PEAQX, 5-phosphonomethyl-1,4-dihydroquinoxaline-2,3-dione; CPP, 4-(3-phosphonopropyl) pizerazine-2-carboxylic acid. Data points correspond to individual cells (n ≥ 107), and the red box plot indicates mean ± SEM.
Figure 5.
Figure 5.
Alanine substitutions in LBDs cause similar changes in surface expression of GluN1/GluN2B receptors as we observed for GluN1/GluN2A receptors. A, Summary of the relative surface expression of NMDARs consisting of either WT or mutated YFP-GluN1-1a subunits coexpressed with the GluN2B subunit, measured using fluorescence microscopy; ***p < 0.001 versus WT, one-way ANOVA. Data points correspond to individual cells (n ≥ 84), and the red box plot indicates mean ± SEM. B, Correlation analysis of relative surface expression of YFP-GluN1-1a/GluN2A and YFP-GluN1-1a/GluN2B receptors. C, Structural model of the LBD of the GluN2B subunit labeled with l-glutamate–interacting amino acids (based on PDB ID, 4PE5). D, Summary of the relative surface expression of NMDARs consisting of either WT or mutated GFP-GluN2B subunit coexpressed with the WT GluN1-4a subunit, measured using fluorescence microscopy; *p < 0.050, **p < 0.010, and ***p < 0.001 versus WT; one-way ANOVA. Data points correspond to individual cells (n ≥ 64), and the red box plot indicates mean ± SEM. E, Correlation analysis between relative surface expression levels of homologous mutations in GluN2A and GluN2B subunits when coexpressed with the WT GluN1-4a subunit. The plotted points in the graph were labeled according to the amino acid positions of the GluN2A subunit. For normalized concentration–response curves, see Figure S5, and for fitting parameters, see Table 3. F, Correlation analysis between EC50 values measured for WT and mutated GluN1/GluN2A and GluN1/GluN2B receptors. The plotted points in the graph were labeled according to the amino acid positions of the GluN2A subunit.
Figure 6.
Figure 6.
Pathogenic variants in LBDs of both GluN1 and GluN2A subunits affect the surface expression and agonist potency of NMDARs. A, Representative images from HEK293 cells transfected with the WT or mutated YFP-hGluN1-1a subunit either alone or with the hGluN2A subunit. The total and the surface signals (top and bottom row, respectively) of YFP-hGluN1-1a subunits were labeled using an anti-GFP antibody 24 h after the transfection. B, C, Summary of relative surface expression of YFP-hGluN1-1a/hGluN2A receptors containing pathogenic variants within the LBDs of the YFP-hGluN1-1a (B) or hGluN2A (C) subunits, measured using fluorescence microscopy; **p < 0.010; ***p < 0.001 versus respective WT; one-way ANOVA. Data points correspond to individual cells (n ≥ 16), and the red box plot indicates mean ± SEM. D, Representative whole-cell voltage–clamp recordings from HEK293 cells transfected with the indicated NMDAR subunits. Glycine (gly) at the indicated concentrations was applied in the continuous presence of 300 µM l-glutamate (l-glu). E, Normalized concentration–response curves for glycine measured from HEK293 cells expressing WT or mutated YFP-hGluN1-1a/hGluN2A receptors obtained by fitting the data using Equation 1 (see Materials and Methods); for the summary of fitting parameters, see Table 5.
Figure 7.
Figure 7.
Microscopical and electrophysiological characterization of the mutant cycles of the GluN1-S688 and GluN2A-S511 residues. A, Summary of the relative surface expression of NMDARs containing the indicated mutations of the GluN1-S688 residue, measured using fluorescence microscopy; *p < 0.050 and ***p < 0.001 versus WT; one-way ANOVA. Data points correspond to individual cells (n ≥ 82), and the red box plot indicates mean ± SEM. B, Normalized concentration–response curves for glycine (gly) measured from HEK293 cells expressing WT and mutant NMDARs were obtained by fitting the data using Equation 1 (see Materials and Methods); for the summary of fitting parameters, see Table 5. C, Correlation analysis of surface expression and EC50 values for glycine for WT and mutated YFP-hGluN1-1a/hGluN2A receptors containing the S688 residue mutant cycle variants, fitted by linear regression. For Kd value estimations, see Figure S6; for the correlation analysis of EC50 and Kd values for glycine, see Figure S7. D, Summary of the relative surface expression of NMDARs containing the indicated mutations, measured using fluorescence microscopy; *p < 0.050 and ***p < 0.001 versus WT; one-way ANOVA. Data points correspond to individual cells (n ≥ 29), and the red box plot indicates mean ± SEM. E, Normalized concentration–response curves for l-glutamate (l-glu) measured from HEK293 cells expressing NMDARs containing mutations of the GluN2A-S511 residue obtained by fitting the data using Equation 1 (see Materials and Methods); for the summary of fitting parameters, see Table 5. F, Correlation analysis of relative surface expression values and EC50 values for l-glutamate for WT and mutated YFP-hGluN1-1a/hGluN2A receptors fitted by linear regression. For Kd value estimations, see Figure S8; for the correlation analysis of EC50 and Kd values for l-glutamate, see Figure S9.
Figure 8.
Figure 8.
In silico analysis of the mutant cycles of the GluN1-S688 and GluN2A-S511 residues. A, G, The RMSD values were derived from 1-µs-long atomistic simulations of the glycine (A) or l-glutamate (G) heavy atoms. These values were calculated by least squares fitting the structures to the backbone of the LBDs of either WT GluN1 or mutated GluN1 subunits at S688 residue position (A) and WT GluN2A or mutated GluN2A subunits at S511 residue position (G; PDB ID, 5KCJ). For RMSF values, see Figures S10 and S11. B, H, The SASA values were derived from 1-µs-long atomistic simulations of the glycine (B) or l-glutamate (H) heavy atoms. These values were calculated by least squares fitting the structures to the backbone of the LBDs of either WT GluN1 or mutated GluN1 subunits at S688 residue position (B) and WT GluN2A or mutated GluN2A subunits at S511 residue position (H; PDB, 5KCJ). C, I, Correlation analysis between relative surface expression and RMSD values for the mutant cycles of the GluN1-S688 (C) or GluN2A-S511 (I) residues. The data were fitted by linear regression. For the summary of RMSD values, see Table 6. D, J, Correlation analysis between relative surface expression and SASA values for the mutant cycles of the GluN1-S688 (D) or GluN2A-S511 (J) residues. The data were fitted by linear regression. For the summary of SASA values, see Table 6. E, K, Correlation analysis between EC50 and ΔGbinding values for glycine for the mutant cycle of the GluN1-S688 residue (E) or l-glutamate for the mutant cycle of the GluN2A-S511 residue (K). The data were fitted by linear regression. For the summary of ΔGbinding values, see Table 6. F, L, Correlation analysis between relative surface expression and ΔGbinding values for glycine for the mutant cycle of the GluN1-S688 residue (F) or l-glutamate for the mutant cycle of the GluN2A-S511 residue (L). The data were fitted by linear regression. For the summary of EC50 values, see Table 5; for ΔGbinding values, see Table 6.
Figure 9.
Figure 9.
The role of the pathogenic variants and other mutations in LBDs of both GluN1 and GluN2A subunits in the regulation of the surface expression of NMDARs. A, Representative images of HEK293 cells expressing ARIAD-mNEON-hGluN1-1a construct either alone or with the GluN2A subunit at 0 min (without AL) and 60 min after adding AL. The total and surface signals (top and bottom row, respectively) of ARIAD-mNEON-hGluN1-1a subunits were labeled using an anti-mNEONGreen antibody 24 h after the transfection. B, C, Summary of relative surface expression of NMDARs containing WT or mutated ARIAD-mNEON-hGluN1-1a subunits coexpressed together with WT hGluN2A subunit (B) or WT ARIAD-mNEON-hGluN1-1a subunit coexpressed with WT or mutated hGluN2A subunits (C) measured in the absence or presence (60 min) of AL, using fluorescence microscopy; *p < 0.05, **p < 0.010, and ***p < 0.001 for differences between ARIAD-mNEON-hGluN1-1a/GluN2A receptor and mutated NMDARs in presence of AL; +++p < 0.001 for differences between the absence and presence of AL; two-way ANOVA. Data points correspond to individual cells (n ≥ 54), and the red box plot indicates mean ± SEM. D–F, Summary of the relative surface expression of NMDARs containing mutations within LBDs of YFP-hGluN1-1a and hGluN2A subunits, measured using fluorescence microscopy; **p < 0.01 and ***p < 0.001 versus WT; one-way ANOVA. Data points correspond to individual cells (n ≥ 81), and the red box plot indicates mean ± SEM. G, H, Summary of relative surface expression for NMDARs composed of GluN1-4a and GFP-GluN2A subunits with the closed-cleft (CC) conformation of LBDs in combination with selected substitutions, measured using fluorescence microscopy; *p < 0.05 and ***p < 0.001 versus WT; one-way ANOVA. Data points correspond to individual cells (n ≥ 67), and the red box plot indicates mean ± SEM.
Figure 10.
Figure 10.
Microscopical analysis of the selected mutations of the GluN1-S688 and GluN2A-S511 residues in hippocampal neurons. A, Representative images of hippocampal neurons transfected with the WT or mutated YFP-hGluN1-1a subunits. The total and the surface signal (top and bottom row, respectively) of YFP-GluN1-1a subunits were labeled using an anti-GFP antibody 48 h after the transfection. B, Summary of the relative surface expression of YFP-hGluN1-1a subunits mutated at the S688 residue position, expressed in hippocampal neurons determined using fluorescence microscopy; **p < 0.010 and ***p < 0.001 versus WT; one-way ANOVA. Data points correspond to individual segments (n ≥ 46), and the red box plot indicates mean ± SEM. C, Summary of the relative surface expression of WT YFP-hGluN1-1a alone or cotransfected with the WT hGluN2A subunit expressed in hippocampal neurons determined using fluorescence microscopy; ***p < 0.001 versus WT; Student's t test. Data points correspond to individual segments (n ≥ 38), and the red box plot indicates mean ± SEM. D, Summary of the relative surface expression of WT YFP-hGluN1-1a subunit cotransfected with WT or mutated hGluN2A subunits at the S511 residue position, expressed in hippocampal neurons determined using fluorescence microscopy; **p < 0.010 and ***p < 0.001 versus WT; one-way ANOVA. Data points correspond to individual segments (n ≥ 42), and the red box plot indicates mean ± SEM.

References

    1. Anandakrishnan R, Aguilar B, Onufriev AV (2012) H++ 3.0: automating pK prediction and the preparation of biomolecular structures for atomistic molecular modeling and simulations. Nucleic Acids Res 40:W537–W541. 10.1093/nar/gks375 - DOI - PMC - PubMed
    1. Anson LC, Chen PE, Wyllie DJA, Colquhoun D, Schoepfer R (1998) Identification of amino acid residues of the NR2A subunit that control glutamate potency in recombinant NR1/NR2A NMDA receptors. J Neurosci 18:581–589. 10.1523/JNEUROSCI.18-02-00581.1998 - DOI - PMC - PubMed
    1. Berendsen HJC, Postma JPM, van Gunsteren WF, DiNola A, Haak JR (1984) Molecular dynamics with coupling to an external bath. J Chem Phys 81:3684–3690.. 10.1063/1.448118 - DOI
    1. Blanke ML, VanDongen AMJ (2008) Constitutive activation of the N-methyl-d-aspartate receptor via cleft-spanning disulfide bonds. J Biol Chem 283:21519–21529. 10.1074/jbc.M709190200 - DOI - PMC - PubMed
    1. Case DA, et al. (2024) Amber 2024, University of California, San Francisco.

LinkOut - more resources