. 2025 May 27;16(1):4920.
doi: 10.1038/s41467-025-59969-8.

WNK1 signalling regulates amino acid transport and mTORC1 activity to sustain acute myeloid leukaemia growth

Affiliations

WNK1 signalling regulates amino acid transport and mTORC1 activity to sustain acute myeloid leukaemia growth

Shunlei Duan et al. Nat Commun. .

Abstract

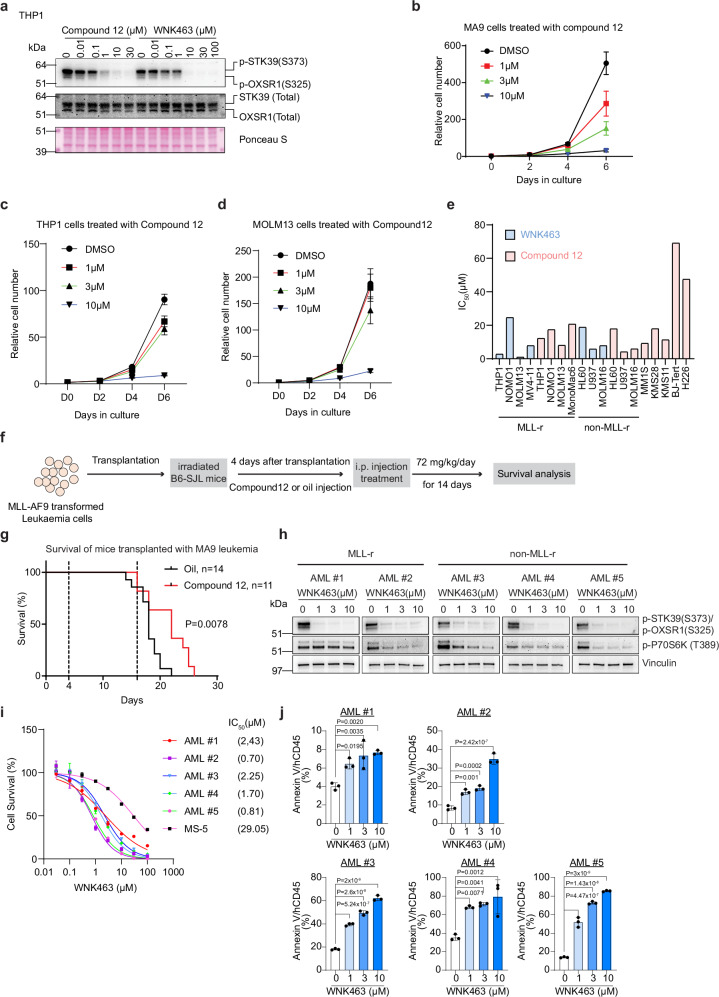
The lack of curative therapies for acute myeloid leukaemia (AML) remains an ongoing challenge despite recent advances in the understanding of the molecular basis of the disease. Here we identify the WNK1-OXSR1/STK39 pathway as a previously uncharacterised dependency in AML. We show that genetic depletion and pharmacological inhibition of WNK1 or its downstream phosphorylation targets OXSR1 and STK39 strongly reduce cell proliferation and induce apoptosis in leukaemia cells in vitro and in vivo. Furthermore, we show that the WNK1-OXSR1/STK39 pathway controls mTORC1 signalling via regulating amino acid uptake through a mechanism involving the phosphorylation of amino acid transporters, such as SLC38A2. Our findings underscore an important role of the WNK1-OXSR1/STK39 pathway in regulating amino acid uptake and driving AML progression.


Conflict of interest statement

Competing interests: K.H. and K.A. are co-founders of Dania Therapeutics. K.H. is a scientific advisor for Hannibal Innovation and was recently a scientific advisor for Inthera Bioscience AG and for MetaboMed Inc. The remaining authors declare no competing interests.

Figures

Fig. 1
Fig. 1. WNK1 is an essential dependency in AML.
a Immunoblot of WNK1 in Cas9-expressing MA9 leukaemia cells expressing either a non-targeting (NCtrl) sgRNA or two different sgRNAs targeting Wnk1. Ponceau S staining was used as a loading control. Blots are from one representative experiment (n = 1). b, c Drop-out growth competition assays showing the relative percentage over time in days (D) of the indicated sgRNA-positive (GFP positive) Cas9-expressing MA9 leukaemia cells (b), mouse embryonic fibroblasts (MEFs) (c). An sgRNA against an essential gene (Rps19) was used as a positive control and a non-targeting sgRNA (NCtrl) was used as a negative control. Data shown are from one representative experiment (n = 1). d Drop-out growth competition assays showing the relative percentage over time in days of the indicated Cas9-expressing human AML cells that express a WNK1 sgRNA. An sgRNA against an essential gene (RPS19) was used as a positive control and a non-targeting sgRNA (NCtrl) was used as a negative control. Data shown for NOMO-1, HL-60, U937, and MOLM-13 are from one representative experiment (n = 1). Data shown for THP-1 and MV4-11 are from one of two independent experiments (n = 2). The driving oncogene is indicated for each of the AML cell lines.
Fig. 2
Fig. 2. The WNK1 dependency in AML is mediated through OXSR1/STK39.
a Schematic for the WNK1-OXSR1/STK39 pathway. b Immunoblot of OXSR1 in Cas9-expressing MA9 leukaemia cells that express either a non-targeting sgRNA or two independent sgRNAs targeting Oxsr1. Ponceau S staining was used as a loading control. Blots are from one representative experiment (n = 1). c Drop-out growth competition assays showing the relative percentage over time in days of the indicated sgRNA-positive (GFP positive) Cas9-expressing MA9 leukaemia cells. An sgRNA against an essential gene (Rps19) was used as a positive control and a non-targeting sgRNA (NCtrl) was used as a negative control. Data shown are from a single representative experiment (n = 1). d Immunoblot of OXSR1 and STK39 in Cas9-expressing human leukaemia cells containing the indicated sgRNAs targeting OXSR1 or STK39. The samples were derived from the same experiment, but different gels for OXSR1, another for STK39 were processed in parallel. Ponceau S staining was used as a loading control. Blots are from one representative experiment (n = 1). e Drop-out growth competition assays showing the relative percentage over time in days of the indicated sgRNA-positive (GFP for OXSR1 sgRNA and RFP for STK39 sgRNA) Cas9-expressing human THP1 AML cells. An sgRNA against an essential gene (RPS19) was used as a positive control and a non-targeting sgRNA (NCtrl) was used as a negative control. Data shown are from one representative experiment (n = 1). f Schematic for WNK1-mediated phosphorylation sites on OXSR1/STK39. g Immunoblot using an HA antibody showing the expression of HA-tagged OXSR1WT, OXSR1D164A, OXSR1185E and OXSR1T185E,S325E. Blots are from one representative experiment (n = 1). The samples were derived from the same experiment, but different gels for HA, another for β-Actin were processed in parallel. h Drop-out growth competition assays, depicting the relative percentage over time in days of the indicated sgRNA-positive (GFP positive) Cas9-expressing MA9 leukaemia cells that ectopically express OXSRWT,OXSR1D164A,OXSR1T185E,S325E. Data shown are from one representative experiment (n = 1). i Drop-out growth competition assays, depicting the relative percentage over time in days of the Wnk1 sgRNA-positive (GFP positive) Cas9-expressing MA9 leukaemia cells ectopically expressing OXSRWT, OXSR1D164A, or OXSR1T185E,S325E. Data shown are from one representative experiment (n = 1). j Drop-out growth competition assays, depicting the relative percentage over time in days of the WNK1 sgRNA-positive (GFP positive) Cas9-expressing human leukaemia cells that ectopically express OXSR1WT, STK39WT, OXSR1T185E,S325E or STK39T233E,S373E. Data shown are from one representative experiment (n = 1).
Fig. 3
Fig. 3. Targeting WNK1 prolongs survival of mice with AML.
a Schematic illustration of the experimental approach employed to generate tamoxifen-inducible Wnk1fl/+, Wnk1fl/− and Wnk1fl/D368A MLL-AF9 leukaemia cell lines. c-KIT+ BM cells were transduced with MLL-AF9 oncogene and serially replated for five rounds in methylcellulose medium. The pre-leukaemia cells were transplanted into sublethally irradiated mice and leukaemia cells were isolated from the mice that developed leukaemia. b Growth curve of Wnk1fl/+, Wnk1fl/− and Wnk1fl/D368A leukaemia cells in vitro treated with/without 500 nM OHT. Ethanol (EtOH) was used as a control. Data are presented as mean ± SD of three biological replicates (n = 3). c FACS analysis of EdU incorporation in Wnk1fl/+, Wnk1fl/− and Wnk1fl/D368A leukaemia cells treated with 500 nM OHT for 48 and 72 h, showing a decreased S phase faction and an increased sub-G1 fraction, indicative of cell death. Data are representative of two independent experiments (n = 2). d Schematic of the experimental setup to test the requirement of WNK1 for AML in vivo. Sublethally irradiated B6.SJL recipient mice were reconstituted with Wnk1fl/+, Wnk1fl/− and Wnk1fl/D368A leukaemia cells and the mice were treated with either tamoxifen or oil two weeks after transplantation. Mice were treated with Tamoxifen/oil for seven consecutive days and monitored for survival. e–g Kaplan–Meier survival curves of recipient mice transplanted with the indicated leukaemia cells. Statistical significance was calculated using a log-rank test.
Fig. 4
Fig. 4. Pharmacological inhibition of WNK1 reduces AML growth.
a WNK1 inhibitors elicit a dose–dependent decrease in human OXSR1 and STK39 phosphorylation. Western blot analysis of phospho-OXSR1(S325)/phospho-STK39(S373) and total OXSR1 and STK39 in human THP1 lysates treated with WNK463 or Compound 12 at the indicated concentrations. Ponceau S staining served as a loading control. Blots are from one representative experiment (n = 1). The samples were derived from the same experiment, but different gels for phospho-OXSR1(S325)/phospho-STK39(S373), another for OXSR1/STK39 (total) were processed in parallel. b–d Growth curve of MA9 (b), human THP1 (c) and human MOLM13 (d) leukaemia cells treated with Compound 12 at the indicated concentrations. Data are presented as mean ± SD of three independent experiments (n = 3). e IC50 values of WNK1 inhibitors for a panel of indicated cancer lines. f Schematic of WNK inhibitor treatment strategy. Sublethally irradiated B6.SJL recipient mice were transplanted with MA9 leukaemia cells, and the mice were intraperitoneally injected with Compound 12 (72 mg/kg) on day 4 after transplantation. The treatment with Compound12 was sustained for a period of 14 days. g Kaplan–Meier survival curves of recipient mice transplanted with MA9 leukaemia cells receiving oil or Compound12 treatment. Statistical significance was calculated using a log-rank test. h Western blot analysis of p-OXSR1, p-STK39 and p-S6K in AML patient samples treated with WNK463. AML #1 and AML #2 are MLL-rearranged, while AML #3, AML #4, and AML #5 are MLL-non-rearranged. Patient samples were treated with WNK463 at 1, 3, or 10 µM for 2 h. Blots for each patient sample are from one representative experiment (n = 1). The samples were derived from the same experiment, but different gels for p-STK39(S373)/p-OXSR1(S325) and Vinculin, another for p-P70S6K (T389) were processed in parallel. Vinculin served as a loading control. i WNK463 dose–response curves for a panel of primary AML samples. Data are presented as mean ± S.D. (n = 3). The IC50 for each sample is shown in brackets. j Percentage of Annexin V-positive cells among human hCD45-positive cells in a panel of human primary AML samples following treatment with WNK463 at the indicated concentrations. Analysis of AML#1, AML#2, and AML#3 was performed on day 3 after treatment with WNK463, whereas AML#4 and AML#5 were analysed on day 7. Data are presented as mean ± s.d. (n = 3). Statistical analysis was performed using one-way ANOVA followed by Dunnett’s post-hoc test to compare each WNK463 concentration to the untreated control.
Fig. 5
Fig. 5. WNK1-OXSR1/STK39 pathway controls mTORC1 signalling.
a Experimental workflow for the phosphoproteome analysis. b Volcano plot showing changes in the phosphoproteome in MA9 leukaemia cells treated with 30 µM Compound 12 for 3 h. Significantly regulated phosphosites of mTORC1 downstream targets are highlighted in colour (FDR  <  0.05). Statistical analysis was performed using the MSstatsTMT package with two-sided tests and Benjamini-Hochberg correction for multiple comparisons. Adjusted p-values (FDR < 0.05) were used to determine significance. c Schematic depicting WNK1 depletion/inhibition leads to inhibition of mTORC1 signalling. d Immunoblot analysis of the indicated mTORC1 downstream proteins of Wnk1fl/− MA9 leukaemia cells in the presence of OHT (500 nM, 48 h), Compound 12 (C12) (10 µM, 1 h), WNK463(W463) (10 µM, 1 h), Rapamycin (RAPA) (10 µM, 1 h). Blots are representative of at least three independent experiments (n > 3). The samples were derived from the same experiment, but different gels for p-OXSR1(S325) and p-4EBP1(T37/46), another for p-P70S6K (T389) and p-4EBP1/2/3(T45), another for Actin and 4EBP1 (Total), and another for 4EBP2 (Total) were processed in parallel. Ponceau S staining and Actin served as loading controls. e Immunoblot analysis of the indicated mTORC1 downstream proteins of Wnk1fl/− MA9 leukaemia cells ectopically expressing OXSRWT, STK39WT, OXSR1T185E, S325E or STK39T233E, S373E. The cells were treated with OHT (500 nM) for 48 h. Blots are representative of two independent experiments (n = 2). The samples were derived from the same experiment, but different gels for OXSR1 (Total) and p-4EBP1(T37/46), another for STK39 (Total) and 4EBP1 (Total), another for p-P70S6K (T389) and p-4EBP1/2/3(T45), another for P70S6K (Total) and 4EBP2 (Total), and another for Actin were processed in parallel. Actin served as a loading control. f Left, schematic of the degron system for the targeted degradation of WNK1 in MA9 leukaemia cells. Right, immunoblot analysis of indicated proteins at the indicated times after treatment with 500 nM dTAG-13. Blots are representative of three independent WNK1-degron clones (n = 3). The samples were derived from the same experiment, but different gels for WNK1 and p-OXSR1(S325), another for HA and p-P70S6K (T389), another for P70S6K (Total) and Vinculin were processed in parallel. Ponceau S staining and Vinculin served as loading controls. g Protein synthesis rates as measured by incorporation of OP-puro in Wnk1fl/− MA9 leukaemia cells treated with 10 µM Compound 12 at the indicated time points. Error bars represent mean ± SD from three biological replicates (n = 3). Statistical analysis was performed using one-way ANOVA followed by Dunnett’s post-hoc test to compare each Compound 12-treated time point to the untreated control.
Fig. 6
Fig. 6. WNK1-OXSR1/STK39 pathway regulates amino acid transport.
a Immunoblot analysis of indicated proteins in Wnk1fl/− MA9 leukaemia cells knocking out Nprl2 with three individual sgRNAs. The cells were treated with 10 µM Compound 12 or DMSO for 1 h. Blots are representative of at least three independent experiments (n > 3). The samples were derived from the same experiment, but different gels for NPRL2 and Vinculin, another for p-P70S6K (T389) and p-4EBP1(T37/46), another for P70S6K (Total) and 4EBP1 (Total) were processed in parallel. Ponceau S staining and Vinculin served as loading controls. b Schematic depicting the workflow of amino acid profiling by targeted LC-MS metabolomics analysis and relative amino acid abundance shown as a heat map. Percent changes are relative to cells without 10 µM Compound 12 (C12) or 500 nM OHT treatment. c–d Glutamine/Glutamate levels as measured by a bioluminescent assay in Wnk1fl/− MA9 leukaemia cells treated with 500 nM OHT (c) or Compound 12 (d) at the indicated time points. Error bars represent mean ± SD from three biological replicates (n = 3). Statistical analysis was performed using one-way ANOVA followed by Dunnett’s post-hoc test to compare each OHT-treated time point to the untreated control (Ctrl) in (c). A two-sided Student’s t test was used to compare each Compound 12-treated time point to the untreated controls in (d). e Examination of glutamine uptake in Wnk1fl/− MA9 leukaemia cells at the indicated times after treatment with 10 µM Compound 12. Error bars represent mean ± SD from five biological replicates (n = 5). f, g Interaction of SLC38A2 with OXSR1. 293 T cells expressing the indicated HA/V5-tagged proteins were lysed and subjected to HA/V5 immunoprecipitation followed by immunoblotting for the indicated proteins. Blots are representative of two independent experiments (n = 2). The samples were derived from the same experiment, but different gels for HA, another for V5 were processed in parallel in f and g. h OXSR1 phosphorylates SLC38A2. Kinase assay was performed by incubating the indicated recombinant OXSR1, purified SLC38A2 (175 aa), and [γ−32P]-ATP in kinase reaction buffer at 30 °C for 1 h. Data are representative of two independent experiments (n = 2). The samples were derived from the same experiment, but different gels for autoradiography, and another for Coomassie staining were processed in parallel. i Model for the role of the WNK1-OXSR1/STK39 pathway in regulating amino acid uptake and mTORC1 signalling.

References

    1. Dohner, H., Weisdorf, D. J. & Bloomfield, C. D. Acute myeloid leukemia. N. Engl. J. Med.373, 1136–1152 (2015). - PubMed
    1. Dohner, H. et al. Diagnosis and management of AML in adults: 2017 ELN recommendations from an international expert panel. Blood129, 424–447 (2017). - PMC - PubMed
    1. Papaemmanuil, E. et al. Genomic classification and prognosis in acute myeloid leukemia. N. Engl. J. Med.374, 2209–2221 (2016). - PMC - PubMed
    1. Ley, T. J. et al. Genomic and epigenomic landscapes of adult De Novo acute myeloid leukemia. N. Engl. J. Med.368, 2059–2074 (2013). - PMC - PubMed
    1. Short, N. J. et al. Advances in the treatment of acute myeloid leukemia: new drugs and new challenges. Cancer Discov.10, 506–525 (2020). - PubMed

MeSH terms

Substances

LinkOut - more resources