. 2025 May 27;16(1):4892.
doi: 10.1038/s41467-025-60037-4.

Chondrocyte fatty acid oxidation drives osteoarthritis via SOX9 degradation and epigenetic regulation

Affiliations

Chondrocyte fatty acid oxidation drives osteoarthritis via SOX9 degradation and epigenetic regulation

Zixuan Mei et al. Nat Commun. .

Abstract

Osteoarthritis is the most prevalent age-related degenerative joint disease and is closely linked to obesity. However, the underlying mechanisms remain unclear. Here we show that altered lipid metabolism in chondrocytes, particularly enhanced fatty acid oxidation (FAO), contributes to osteoarthritis progression. Excessive FAO causes acetyl-CoA accumulation, thereby altering protein-acetylation profiles, where the core FAO enzyme HADHA is hyperacetylated and activated, reciprocally boosting FAO activity and exacerbating OA progression. Mechanistically, elevated FAO reduces AMPK activity, impairs SOX9 phosphorylation, and ultimately promotes its ubiquitination-mediated degradation. Additionally, acetyl-CoA orchestrates epigenetic modulation, affecting multiple cellular processes critical for osteoarthritis pathogenesis, including the transcriptional activation of MMP13 and ADAMTS7. Cartilage-targeted delivery of trimetazidine, an FAO inhibitor and AMPK activator, demonstrates superior efficacy in a mouse model of metabolism-associated post-traumatic osteoarthritis. These findings suggest that targeting chondrocyte-lipid metabolism may offer new therapeutic strategies for osteoarthritis.


Conflict of interest statement

Competing interests: The authors declare no competing interests.

Figures

Fig. 1
Fig. 1. Synergistic effects of lipid stress and inflammatory-mechanical factors on chondrocyte fatty acid uptake and OA progression.
a Illustration of the CM system, created by figdraw.com. b 3D-agarose culture and alcian blue staining of primary mouse chondrocytes cultured in fibro-CM, adipo-CM, or fibro-CM supplemented with 200 μM FFA (n = 6). c Immunoblot detection of ACAN, COL2A1, SOX9, MMP3, and MMP13 in primary mouse chondrocytes treated with FFA. d Fatty acid uptake in mouse chondrocytes pretreated with FFA or BSA control (n = 5). e Bodipy 493/503 staining of mouse chondrocytes treated with BSA or FFA in combination with or without IL-1β (n = 6). f Illustration of diet change and destabilization of the medial meniscus (DMM) surgery or sham operation in male C57BL/6J mice (n = 8), created by figdraw.com. g Bodipy 493/503 and Nile red staining of knee joints from mice indicated in this figure (f). (n = 7 for ND + DMM and HFD+Sham groups; n = 8 for ND+Sham and HFD + DMM groups). hi Safranin O/Fast green staining of knee joints from mice indicated in this figure (f) (n = 8). jk Safranin O/Fast green staining and Bodipy 493/503 or Nile red staining of human knee cartilage tissues from patients after total-knee arthroplasty, categorized based on BMI values (n = 18 for Lean groups, n = 22 for obese groups, biologically independent samples). l Total FFA levels in synovial fluids from patients with mild (n = 40), moderate (n = 36), and severe (n = 44) OA (Left), and from patients classified as Lean (n = 52) or with obesity (n = 40) (Right). b, d right and l Data are minimum to maximum: each point represents an individual biological replicate, box from 25th to 75th percentiles; center line at median; tukey whiskers, as determined via one-way ANOVA followed by Dunn’s or Tukey’s multiple-comparisons test (b and l, left) or two-tailed t-test (d, right), or nonparametric two-tailed Mann–Whitney test (l, right). d, left and ek Data are mean ± SD, as determined by two-tailed t-test or nonparametric two-tailed Mann–Whitney test. The immunoblotting data are representative of three independent experiments. Source data are provided as a Source Data file.
Fig. 2
Fig. 2. Fatty acid-derived acetyl-CoA activates chondrocyte FAO via HADHA acetylation at lysine 728.
a Quantification of 13C-labeled acetyl-CoA levels in cartilage samples from mice that underwent DMM surgery, indicated in Fig. S3a (n = 4). b Western blot analysis of acetyl-lysine from whole cartilage lysate obtained from mice in Fig. 1f. The immunoblotting results are representative of three independent experiments. c Bubble chart showing the top 20 enriched MFs among the upregulated acetylated proteins in HFD + DMM versus ND + DMM groups, as determined by a two-tailed Fisher’s exact test. d Heatmap showing acetylated lysine sites on proteins involved in lipid metabolic process in HFD + DMM versus ND + DMM groups. e Real-time relative-enzyme activity of Flag-tagged HADHA purified from C28/I2 cells treated with FFA or TSA + NAM. The area under the curve (AUC) was generated by Prism 9.5.1. Relative HADHA activity was calculated at 20 min (n = 4). f Real-time relative-enzyme activity of Flag-tagged wild-type HADHA or HADHA K728R purified from HADHA-KO C28/I2 cells treated with FFA or BSA. The AUC was generated using Prism 9.5.1. Relative HADHA activities were calculated at 30 min (n = 4). g Mitochondrial fuel oxidation analysis. HADHA-KO C28/I2 cells overexpressing wild-type HADHA or HADHA K728R were both pretreated with FFA for 24 h before loading. The cells were then sequentially treated with UK5099, BPTES, and Eto (n = 5 for HADHA WT group; n = 6 for HADHA K728R group). h Molecular interactions of wild-type, K728R, and K728ac HADHA with the substrate. The SASA and binding energy were calculated. a, e right, f right, and g right Data are minimum to maximum: each point represents an individual biological replicate, box from 25th to 75th percentiles; center line at median; tukey whiskers, as determined via unpaired two-tailed t-test (a and g right) or one-way ANOVA followed by Dunnett’s multiple-comparisons test (e right), or two-way ANOVA followed by Tukey’s multiple-comparisons test (f right). e left, f left, and g left Data are mean ± SD, as determined via one-way ANOVA followed by Dunnett’s multiple-comparisons test. Source data are provided as a Source Data file.
Fig. 3
Fig. 3. Enhanced FAO exacerbates OA phenotype in vivo and in vitro.
a Immunoblot detection of ACAN, COL2A1, SOX9, MMP3, MMP13, and HADHA in mouse chondrocytes transfected with Hadha siRNAs. All cells were treated with 200 μM FFA. b mRNA expression levels of Hadha in mouse chondrocytes infected with a lentivirus encoding Hadha short hairpin RNA #2 (n = 6). c, d Micromass culture (c) or 3D-agarose culture (d) and alcian blue staining of murine chondrocytes infected with a lentivirus encoding Hadha short hairpin RNA #2 (n = 6). All cells were treated with 200 μM FFA. e 3D-agarose culture and alcian blue staining of murine chondrocytes treated with FFA or FFA + TMZ (n = 6). f Immunoblot detection of COL2A1, SOX9, MMP13, and HADHA in HADHA-KO C28/I2 cells overexpressing HADHA or harboring the empty vector. All cells were treated with 200 μM FFA. g Immunoblot detection of ACAN, COL2A1, SOX9, MMP13, and HADHA in HADHA-KO C28/I2 cells overexpressing wild-type HADHA, HADHA K728R mutant, or harboring the empty vector. All cells were treated with 200 μM FFA. h Safranin O/Fast green staining and IHC staining for HADHA in knee joints of Hadhafl/fl and Hadhafl/fl; Acan-creERT2 mice that underwent DMM or sham surgery. Samples were collected 12 weeks after surgery (n = 8). i Safranin O/Fast green staining; IHC staining for HADHA and HADHA K728ac; and IF staining for COL2A1 and MMP13 in knee joints from Hadha K728RCKI/CKI and Hadha K728RCKI/CKI; Acan-creERT2 mice that underwent DMM surgery and fed HFD or ND. Samples were collected 8 weeks after surgery (n = 8). b, h, and i Data are mean ± SD, as determined via unpaired two-tailed t-test, or nonparametric Mann–Whitney test. ce Data are minimum to maximum: each point represents an individual biological replicate, box from 25th to 75th percentiles; center line at median; tukey whiskers, as determined via unpaired two-tailed t-test (c, d) or one-way ANOVA followed by Tukey’s multiple-comparisons test (e). The immunoblotting data are representative of three independent experiments. Source data are provided as a Source Data file.
Fig. 4
Fig. 4. FAO inhibition amplifies AMPK activity and stabilizes SOX9.
a Sox9 mRNA levels in mouse chondrocytes treated with FFA (n = 6). b, c Immunoblot analysis of SOX9 in primary murine chondrocytes treated as indicated. d ATP production after FFA exposure in HADHA-KO C28/I2 cells overexpressing wild-type HADHA or HADHA K728R or harboring the empty vector (n = 3). e Immunoblot of p-ACC/ACC, p-AMPK/AMPK, SOX9, and HADHA in Hadhafl/fl murine chondrocytes infected with Cre or adenovirus vector 72 h before harvesting. f Immunoblot detection of ubiquitinated Flag-tagged SOX9 overexpressed in C28/I2 cells via Flag immunoprecipitation. g Heatmap showing the results of UPLC-MS/MS analysis for identifying phosphorylation sites on the SOX9 protein purified from C28/I2 cells. The presence, absence, or lack of detection of modifications at the specified sites in the SOX9 protein are denoted by ‘1’, ‘−1’, and ‘0’ respectively. h Immunoblot detection of AMPK phosphorylates consensus motif (p-AMPK motif) in Flag-tagged wild-type, and SOX9 ST-A mutant overexpressed in C28/I2 cells using an anti-p-AMPK-motif antibody via Flag immunoprecipitation. i Immunoblot detection of ubiquitinated, Flag-tagged wild-type, ST-A, and ST-D SOX9 overexpressed in C28/I2 cells via Flag immunoprecipitation. ST-A and ST-D denote SOX9 variants with six serine/threonine residues mutated to alanine and aspartate residues, respectively. j Co-immunoprecipitation of SOX9 with TRIM9 in HEK293T cells treated with FFA or BSA. k Co-immunoprecipitation of Flag-tagged wild-type SOX9 or SOX9 mutants with HA-TRIM9 in HEK293T cells. l Molecular docking results demonstrating the interaction between wild-type or ST-phosphorylated SOX9 and TRIM9. m Immunoblot detection of TRIM9 and SOX9 in HEK293T cells transfected with TRIM9 siRNAs. n Immunoblot detection of p-ACC/ACC, p-AMPK/AMPK, SOX9, and HADHA in HADHA-KO C28/I2 cells overexpressing wild-type HADHA, HADHA K728R mutant, or harboring the empty vector. o IF staining for p-ACC and IHC staining for SOX9 in mouse-knee cartilage tissues indicated in Fig. 3i (n = 8). Data are mean ± SD, as determined by one-way ANOVA followed by Dunnett’s multiple-comparisons test (a, d), or unpaired two-tailed t-test (o). The immunoblotting data are representative of three independent experiments. Source data are provided as a Source Data file.
Fig. 5
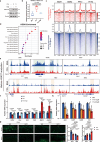
Fig. 5. FAO-driven epigenetic reprogramming controls OA pathogenicity.
a Immunoblot detection of H3K27ac in murine chondrocytes treated with BSA, FFA (200 μM), or FFA (200 μM) + TMZ (300 μM) for 48 h. b Relative fluorescence-intensity ratio of H3K27ac to histone H3 in mouse chondrocytes treated with BSA, FFA, or FFA + TMZ. See Fig. S9a for additional details. c Heatmaps displaying a spike in normalized coverages of global H3K27 acetylation in mouse chondrocytes treated with FFA or a BSA control. d KEGG enrichment analysis of genes around significantly altered H3K27ac peaks (log2 FC > 1, P < 0.01), as determined by a two-tailed Fisher’s exact test followed by Benjamini–Hochberg (BH) correction. e Analysis of H3K27ac at gene clusters in BSA- or FFA-treated mouse chondrocytes, including Acan, Col2a1, Hdac3, Pdk4, Mmp13, and Adamts7. f mRNA expression levels of Col2a1, Acan, Sox5, Sox6, Mmp13, and Adamts7 in mouse chondrocytes treated with BSA, FFA, or FFA + TMZ, as assessed via RT-qPCR (n = 4). g IF staining for ACAN and PDK4 in mouse-knee cartilage tissues represented in Fig. 1f (n = 8). h mRNA expression levels of Apob, Srebf1, Srebf2, and Esr1 in mouse chondrocytes treated with the indicated concentrations of FFA, as assessed via RT-qPCR (n = 4). b Data are the minimum to maximum: each point represents an individual biological replicate, box from 25th to 75th percentiles; center line at median; tukey whiskers, as determined via nonparametric two-tailed Mann–Whitney test. fh Data are mean ± SD, as determined by two-tailed t-test (fg) or one-way ANOVA followed by Dunnett’s multiple-comparisons test (h). The immunoblotting data are representative of three independent experiments. Source data are provided as a Source Data file.
Fig. 6
Fig. 6. Targeted delivery of TMZ to cartilage tissues with red blood cell exosomes (RBC-Exos) alleviates OA.
a Schematic illustration of CAP-RBC-EXOs used for the targeted delivery of TMZ to chondrocytes for OA treatment, created by figdraw.com. bd Safranin O/Fast green staining; IF staining for COL2A1, MMP13, and p-ACC; and IHC staining for SOX9 in knee joints from mice fed an HFD or ND that underwent DMM surgery, followed by CAP-RBC-Exo/TMZ or CAP-RBC-Exo/PBS arthrocentesis (n = 8). The data represent the mean ± SD, as determined by two-tailed t-test or nonparametric two-tailed Mann–Whitney test. Source data are provided as a Source Data file.
Fig. 7
Fig. 7. Schematic representation of the fatty acid-FAO-epigenetic regulatory network in the context of ObOA.
Fatty acids that accumulate in chondrocytes enter the FAO pathway and lead to acetyl-CoA accumulation, which reshapes the chondrocyte protein acetylation profile. Mitochondrial acetyl-CoA facilitates the acetylation of HADHA, enhancing its enzymatic activity and creating a positive feedback loop that further amplifies FAO. Concurrently, excessive FAO suppresses AMPK activity, resulting in reduced phosphorylation and increased ubiquitination-mediated degradation of SOX9. In parallel, nuclear acetyl-CoA alters histone acetylation patterns, promoting transcriptional activation of ECM catabolic genes such as MMP13 and ADAMTS7 while suppressing ECM anabolic genes including ACAN and COL2A1. These combined effects disrupt ECM turnover and accelerate cartilage degradation. Pharmacological inhibition of FAO using TMZ effectively interrupts this pathological cascade and mitigates OA progression (created by figdraw.com).

References

    1. Martel-Pelletier, J. et al. Osteoarthritis. Nat. Rev. Dis. Prim.2, 16072 (2016). - PubMed
    1. Han, S. Osteoarthritis year in review 2022: biology. Osteoarthr. Cartil.30, 1575–1582 (2022). - PubMed
    1. Egunsola, A. T. et al. Loss of DDRGK1 modulates SOX9 ubiquitination in spondyloepimetaphyseal dysplasia. J. Clin. Investig.127, 1475–1484 (2017). - PMC - PubMed
    1. Bar Oz, M. et al. Acetylation reduces SOX9 nuclear entry and ACAN gene transactivation in human chondrocytes. Aging Cell15, 499–508 (2016). - PMC - PubMed
    1. Ng, L. J. et al. SOX9 binds DNA, activates transcription, and coexpresses with type II collagen during chondrogenesis in the mouse. Dev. Biol.183, 108–121 (1997). - PubMed

MeSH terms