. 2025 May 27;16(1):4908.
doi: 10.1038/s41467-025-60092-x.

Soft matrix promotes immunosuppression in tumor-resident immune cells via COX-FGF2 signaling

Affiliations

Soft matrix promotes immunosuppression in tumor-resident immune cells via COX-FGF2 signaling

Aino Peura et al. Nat Commun. .

Abstract

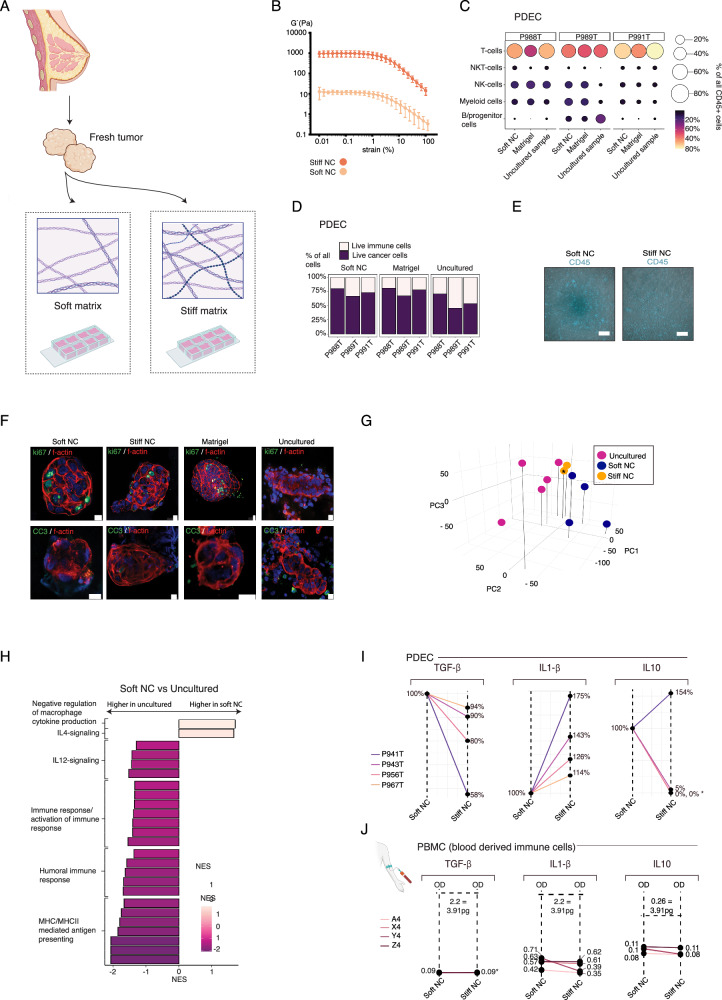
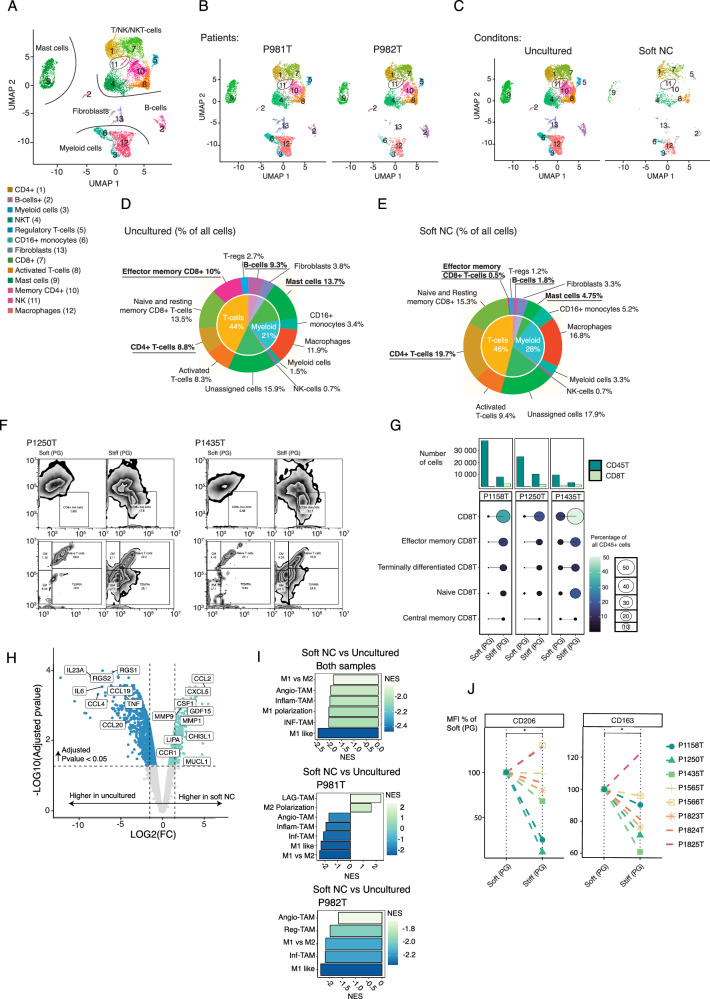
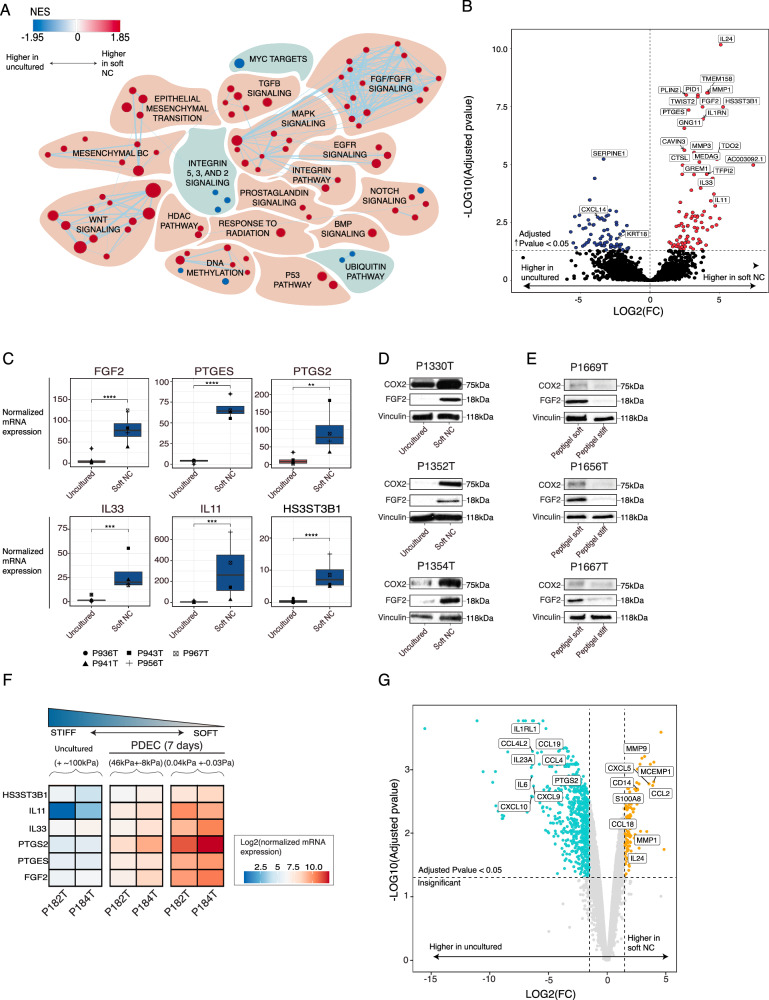
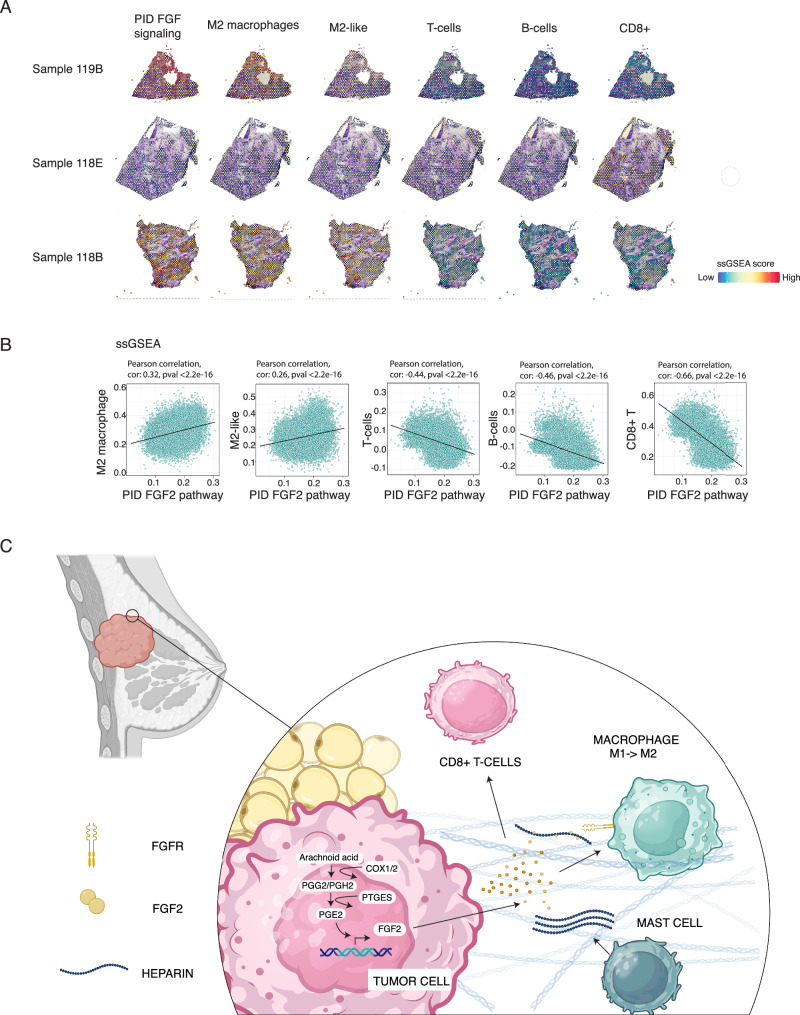
Mechanical forces of the tumor microenvironment change dynamically during key events of tumorigenesis such as invasion and metastasis. These changes in compressive forces often affect the breast cancer cell phenotype. However, it is lesser known how these dynamic mechanical forces in the tumor microenvironment affect the phenotypes of tumor infiltrated leukocytes (TIL) and their subsequent anticancer activities. Here we find, in primary patient-derived explant cultures (PDEC) containing resident TILs, that low compression promotes a change in the original identity of breast cancer cells from luminal to a more mesenchymal and undifferentiated state. These altered tumor cells induce an upregulation of immunosuppressive cytokines such as interleukin-10 (IL-10) and Transforming Growth Factor Beta (TGF-β), as well as polarization of macrophages towards pro-tumor M2(Gc)-type and depletion of CD8+ effector memory T-cells. These immunosuppressive events are mediated by tumor cell derived fibroblast growth factor 2 (FGF2) and prostaglandin E2 (PGE2). We also find that FGF2 rich areas in primary tumors show enrichment in M2-like-macrophages and diminished numbers of CD8 + T and B-cells. Our results suggest that low compressive forces in the tumor microenvironment induce local immunosuppression via FGF2 secretion arising from phenotypic plasticity of tumor cells.


Conflict of interest statement

Competing interests: The authors declare no competing interests.

Figures

Fig. 1
Fig. 1. Soft matrix preserves the immune cell content of the original tumor tissue in PDECs.
A Schematic representation of the patient derived explant cultures (PDEC) in soft and stiff microenvironments. Created in BioRender. Peura, A. (2025). https://BioRender.com/q2r8igh. B The rheological strain sweep measurements of the soft and stiff nanocellulose (NC) matrices (n = 5 per matrix stiffness). Dots represent the medium and error bars represent the standard deviation. C The relative percentages of main tumor infiltrated leukocytes (TIL) subtypes from three patient samples cultured in soft nanocellulose (NC) gel and Matrigel in comparison to fresh uncultured tumor, the size of the dot and the color bar indicate the percentage of the cell type in the sample. D The relative numbers of TIL and tumor cells in PDEC samples (n = 3). E PDEC samples cultured for 7 days and stained with CD45. The corresponding live video is in the Supplementary Movie 1-9. The scale bar represents 100 μm. Two tumor samples and one normal sample was grown in each matrix. F PDEC samples cultured for 7 days and stained with cleaved caspase 3 (CC3) and Ki67 (n = 3). The scale bar represents 10 μm. G Principal component analysis (PCA) of the bulk-mRNA from PDEC samples (n = 5 for the uncultured, n = 4 for soft NC). The star indicates that two stiff-NC samples are overlapping in the figure. H Gene Set Enrichment Analysis (GSEA) analysis of gene sets upregulated in the soft NC in comparison to the uncultured sample. I ELISA cytokine assay of four individual patients cultured as PDECs for 3 days. The star indicates that several donors are overlapping in the plot. J ELISA cytokine analysis of four individual peripheral blood mononuclear cell (PBMC) donors with similar cell numbers per matrix and dilution factors as detected from PDEC samples. Levels for all cytokines were below the detection level and hence values are represented as OD-values.
Fig. 2
Fig. 2. CD8 + T-cells are lost, and macrophages are polarized towards M2-like phenotype in the soft matrix PDEC cultures.
A Uniform Manifold Approximation and Projection (UMAP)-representation of all cell types identified from the scRNAseq data. Patient samples were cultured in soft nanocellulose (NC) matrix for 7 days and uncultured original tumor sample was used as a control (n = 2). B UMAP representation of individual patient samples and (C), for culture conditions. D, E Relative amount of main cell types (inner circle) and all cell types (outer circle) in the uncultured sample and sample cultured in the soft NC gel. Clusters that represented more than 5% of cells in the uncultured sample and lost or gained more than 50% of their cells are underlined and bolded. F The flow cytometry gating strategy for CD8 + T-cells of two patient samples grown as patient derived explant cultures (PDEC) in soft and stiff PeptiGel (PG) gels. G Quantification of main CD8 + T-cell subtypes in three patient samples grown in soft and stiff PG gels. Significant comparisons are indicated with line (n = 3). Statistic was calculated with one-sided t-test, exact p-values are shown in the source data. H Top differentially expressed genes in pseudobulk simulated data from myeloid cell/macrophage cluster (clusters macrophages, CD16+ myeloid cells, and myeloid cells) between the uncultured sample and sample cultured in the soft NC gels. Statistics was calculated by EdgeR. I Fgsea-analysis with macrophage related gene sets (source data file) from pseudobulk-data, statistics was calculated with. All represented gene sets are significant with padj < 0.05. J Median fluorescence intensity of two M2-macrophage related markers, CD206 and CD163, between the soft and stiff PG gel cultures (n = 8). Statistics calculated with one-sided Wilcox ranked sum test. Exact p-values are shown in the source data.
Fig. 3
Fig. 3. Upregulation of FGF2 and COX2 expression in the soft matrix PDEC cultures.
A Top differentially upregulated (red) and downregulated (blue) gene sets between the soft nanocellulose (NC) and the original uncultured tumor. The size of the dot represents the gene set size. The list of genes in the gene sets is shown in source data. Only significant (FDR < 0.2) sets are visualized. B Top differentially expressed genes between soft NC and the original uncultured sample. Statistics was calculated by DEseq2. C mRNA level of several immunity and fibroblast growth factor 2 cyclooxygenase 2 (FGF2-COX2) related genes between soft and original uncultured tumor (n = 5). Statistics was calculated with DEseq2. Exact adjusted p-values are 3.2649E-08 for FGF2, 4.4E-08 for PTGES, 0.0011 for PTGS2, 0.00037 for IL11, 0.00010 for IL33 and 3.26E-08 for HS3ST3B1. D, E Protein level analysis of COX2 and FGF2 in three different patients between the soft and the original uncultured tumor, as well as between the soft and stiff PeptiGel (PG). N = 3 for PeptiGels and n = 3 for soft GrowDex. F Normalized mRNA sequencing data shows the expression of selected genes across the matrices with different stiffnesses. G Top differentially expressed genes in pseudobulk simulated expression data between immune cells cultured in the soft NC and in the uncultured samples (n = 2). Statistics was calculated by EdgeR.
Fig. 4
Fig. 4. FGF2 treatment polarizes macrophages to M(Gc)-like.
A Schematic representation of the isolation of CD14+ cells and differentiation into macrophages. Created in BioRender. Peura, A. (2025). https://BioRender.com/e9a70zq. B Median fluorescent intensity of CD163 in the M0 macrophages cultured with fibroblast growth factor 2 (FGF2), heparin + FGF2, heparin overnight and compared with interferon-γ (IFN-γ) + lipopolysaccharide (LPS) (M1) and interleukin (IL-4) + IL-13 (M2a) treated macrophages (M1/M2 n = 4, n = 12). Statistics was calculated with two-sided wilcox test, exact p-values are shown in the source data. C Expression of CCL17, CXCL9, and Tumor necrosis factor alpha (TNF-α) at the mRNA level in the macrophages cultured with FGF2, heparin or with both FGF2 and heparin overnight (n = 4). Statistics was calculated with anova and Tukey HSD. Adjusted p-values are 0.031 for CXCL9 and 0.003 for CCL17. D Quantification of heparin levels from four patient derived explant cultures (PDEC) samples cultured in the soft and the stiff nanocellulose (NC) matrix for 3 days (n = 4). Statistics was calculated with two-sided t-test, exact p-value is 4.22E-07. E, F Western blot protein analysis of cyclooxygenase 2 (COX2) and FGF2 from six different patient samples treated with Ketoprofen or Celecoxib. The protein quantitation is represented as boxplot. Statistics was calculated with two-sided t-test, p-values are 0.02 for soft vs Ketoprofen 0.25 ul, 0.03 for soft vs Ketoprofen 50ul and 0.025 for soft vs Celecoxib. G Median expression of CD163 and CD206 in macrophages from PDECs with NCS12 or Celecoxib supplementation or with combination (n = 4). Statistics was calculated with one-sided t-test, exact p-values are 0.0342 for CD163 and 0,0337 for CD206.
Fig. 5
Fig. 5. FGF2 enriched tumors have less T-cell and B-cell infiltrates.
A Immunohistochemically (IHC) stained fibroblast growth factor 2 (FGF2) expression of 45 primary breast cancer samples representing either estrogen receptor (ER + ) or triple negative breast cancer (TNBC) subtype. The statistical significance was calculated with 2-sided Pearson’s correlation test. B Multiplex and hematoxyline & eosine (H&E) images from 8 samples stained with CD45, EPCAM, CD3, CD20, and CD68. CD45-rich areas are encircled with white lines. The red line encircles a wrinkle in the section. Full size images are presented in Supplementary Fig. 12. Scale bars in immunofluorescent (IF) and H&E images is 100 µm. C–G Quantifications of CD45, CD20, CD3, CD68, EPCAM, and FGF2 positive areas from IHC and IF staining. The expressions of CD45, CD20, CD3, and CD68 was normalized to the size of the tumor tissue (cells/tumor area). Three individual measurements were taken from each image (IF) and one from FGF2 IHC. The statistical significance was calculated with one-sided t-test. Exact p-values are 0.0096 for CD3, 0.033 for CD20 and 0.03 for FGF2.
Fig. 6
Fig. 6. FGF-signaling rich areas have more M2-macrophages and less CD8 + T- and B-cells.
A Spatial feature blots of 9 individual samples representing the expression of fibroblast growth factor (FGF) -signaling, as well as M2-markers and T and B-cell specific markers (ssGSEA). A full list of gene sets is provided in the Source Data file and all images are present in Supplementary Figs. 8 and 9. B Two-sided Pearson correlation was performed between PID_FGF_Pathway and M2, T and B-cell specific signatures defined by ssGSEA. C Schematic representation of the model. Created in BioRender. Peura, A. (2025). https://BioRender.com/0yf2j1z.

References

    1. Winkler, J., Abisoye-Ogunniyan, A., Metcalf, K. & Werb, Z. Concepts of extracellular matrix remodelling in tumour progression and metastasis. Nat. Commun.11, 5120 (2020). - PMC - PubMed
    1. Anderson, N. M. & Simon, M. C. Tumor Microenvironment. Curr. Biol. CB30, R921 (2020). - PMC - PubMed
    1. Mohammadi, H. & Sahai, E. Mechanisms and impact of altered tumour mechanics. Nat. Cell Biol.20, 766–774 (2018). - PubMed
    1. Northcott, J. M., Dean, I. S., Mouw, J. K. & Weaver, V. M. Feeling Stress: The Mechanics of Cancer Progression and Aggression. Front. Cell Dev. Biol.6, 336485 (2018). - PMC - PubMed
    1. Leight, J. L., Drain, A. P. & Weaver, V. M. Extracellular Matrix Remodeling and Stiffening Modulate Tumor Phenotype and Treatment Response. Annu. Rev. Cancer Biol.1, 313–334 (2017).

MeSH terms