. 2025 May 27;16(1):4919.
doi: 10.1038/s41467-025-60226-1.

Ferroptosis-activating metabolite acrolein antagonizes necroptosis and anti-cancer therapeutics

Affiliations

Ferroptosis-activating metabolite acrolein antagonizes necroptosis and anti-cancer therapeutics

Hyun Bae et al. Nat Commun. .

Abstract

Dysregulated cell death leading to uncontrolled cell proliferation is a hallmark of cancer. Chemotherapy-induced cell death is critical for the success of cancer treatment but this process is impaired by metabolic byproducts. How these byproducts interfere with anti-cancer therapy is unclear. Here, we show that the metabolic byproduct acrolein derived from polyamines, tobacco smoke or fuel combustion, induces ferroptosis independently of ZBP1, while suppressing necroptosis in cancer cells by inhibiting the oligomerization of the necroptosis effector MLKL. Loss of the enzyme SAT1, which contributes to intracellular acrolein production, sensitizes cells to necroptosis. In mice, administration of an acrolein-trapping agent relieves necroptosis blockade and enhances the anti-tumor efficacy of the chemotherapeutic drug cyclophosphamide. Human patients with cancer coupled with a higher cell death activity but a lower expression of genes controlling polyamine metabolism exhibit improved survival. These findings highlight that the removal of metabolic byproducts improves the success of certain chemotherapies.


Conflict of interest statement

Competing interests: The authors declare no competing interests.

Figures

Fig. 1
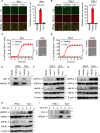
Fig. 1. Spermine triggers inflammatory cell death and activates necroptotic molecules.
A Real-time analysis of cell death in bone marrow-derived macrophages (BMDMs) treated with different doses of spermine (Spm). B Representative images of cell death in BMDMs at 0 and 12 h of indicated doses of Spm treatment. C, D Immunoblot analysis of (C) released lactate dehydrogenase (LDH) and high mobility group box 1 (HMGB1) in the cell culture media; (D) phosphorylated receptor-interacting serine/threonine kinase 3 (pRIPK3), total RIPK3 (tRIPK3), phosphorylated mixed lineage kinase domain-like pseudokinase (pMLKL), and total MLKL (tMLKL) after indicated times of Spm treatment. GAPDH was used as internal control. E, F Immunoblot analysis of (E) pRIPK3, tRIPK3, pMLKL, and tMLKL; (F) released LDH and HMGB1 in the cell culture media in BMDMs after indicated doses of Spm treatment. β-actin was used as an internal control (E). G Real-time analysis of cell death in BMDMs treated with Spm in the presence or absence of necrostatin-1 (Nec-1). H Immunoblot analysis of released LDH and HMGB1 in the cell culture media after indicated treatments in BMDMs. Data are shown as mean ± SEM; ****P < 0.0001 (two-way ANOVA; n = 4 from 4 biologically independent samples) (A and G). Data are representative of at least three independent experiments (BF and H). Scale bar, 100 μm (B). Source data are provided as a Source Data file.
Fig. 2
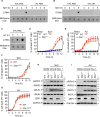
Fig. 2. Ferroptosis inhibition abolishes spermine-induced cell death without altering the activation of RIPK3 and MLKL.
A, B Representative images of oxidized lipids (green) and non-oxidized lipids (red) with merged images and oxidation ratio in BMDMs treated with (A) spermine (Spm) for 9 h; (B) ras-selective lethal small molecule 3 (RSL3) for 6 h. C, D Real-time analysis and representative images of cell death in BMDMs treated with (C) Spm; (D) RSL3 for 6 h in the presence or absence of ferrostatin-1 (Fer-1). E Immunoblot analysis of released lactate dehydrogenase (LDH) and high mobility group box 1 (HMGB1) in cell culture media of BMDMs stimulated with RSL3 and Spm in the presence or absence of Fer-1. F, G Immunoblot analysis of phosphorylated receptor-interacting serine/threonine kinase 3 (pRIPK3), total RIPK3 (tRIPK3), phosphorylated mixed lineage domain-like pseudokinase (pMLKL), and total MLKL (tMLKL) in BMDMs treated with RSL3 and spermine in the presence or absence of (F) Fer-1; (G) necrostatin-1 (Nec-1). H Immunoblot analysis of pRIPK3, tRIPK3, pMLKL, and tMLKL in BMDMs after indicated times of RSL3 and Spm treatment. β-actin was used as an internal control (FH). I Immunoblot analysis of released LDH and HMGB1 in the cell culture media of BMDMs after indicated times of RSL3 and Spm treatment. Data are shown as mean ± SEM (AD). ****P < 0.0001 (one-way ANOVA; n = 4 from 4 biologically independent samples) (A and B). ****P < 0.0001 (two-tailed t test; n = 4 from 4 biologically independent samples) (C and D). Data are representative of at least three independent experiments (AI). Scale bar, 100 μm (AD). Source data are provided as a Source Data file.
Fig. 3
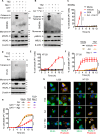
Fig. 3. Spermine-induced ferroptosis is dependent on acrolein.
A Real-time analysis and representative images of cell death in bone marrow-derived macrophages (BMDMs) treated with spermine (Spm) in the presence or absence of ferrostatin-1 (Fer-1), hydralazine (HZ), sodium pyruvate (SP), and dimethylthiourea (DMTU). B Representative images of oxidized lipids (green) and non-oxidized lipids (red) with merged images and oxidation ratio in BMDMs treated with Spm for 12 h in the presence or absence of Fer-1, HZ, SP, and DMTU. C Real-time analysis and representative images of cell death in BMDMs treated with different doses of acrolein (Acr). D Representative images of oxidized lipids (green) and non-oxidized lipids (red) with merged images and oxidation ratio in BMDMs treated with Acr for 6 h in the presence or absence of Fer-1, HZ, SP, and DMTU. E Real-time analysis of cell death in BMDMs stimulated with Acr in the presence or absence of Fer-1, HZ, SP, and DMTU. Data are shown as mean ± SEM (AE). ****P < 0.0001 (two-way ANOVA; n = 4 from 4 biologically independent samples) (A, C, and E). ****P < 0.0001 (one-way ANOVA; n = 4 from 4 biologically independent samples) (B and D). Data are representative of at least three independent experiments (B and D). Scale bar, 100 μm (AD). Source data are provided as a Source Data file.
Fig. 4
Fig. 4. Spermine and acrolein induce accumulation of Z-RNA.
AC Dot blot analysis for Z-RNA in bone marrow-derived macrophages (BMDMs) after stimulation with (A) spermine (Spm) with or without fetal bovine serum (FBS); (B) Spm with FBS or human serum (HS); (C) acrolein (Acr) in FBS. D, E Real-time analysis of cell death in wild-type (WT) and Zbp1−/− BMDMs treated with (D) Spm; (E) Acr. F, G Real-time analysis of cell death in WT and Zbp1∆Zα2 BMDMs treated with (F) Spm; (G) Acr. H, I Immunoblot analysis of phosphorylated receptor-interacting serine/threonine kinase 3 (pRIPK3), total RIPK3 (tRIPK3), phosphorylated mixed lineage kinase domain-like pseudokinase (pMLKL), and total MLKL (tMLKL) in WT and Zbp1−/− BMDMs treated with (H) Spm; (I) Acr in the presence or absence of necrostatin-1 (Nec-1). GAPDH was used as an internal control. Data are shown as mean ± SEM; ****P < 0.0001 (two-way ANOVA and two-tailed t test; n = 4 from 4 biologically independent samples) (DG). Data are representative of at least three independent experiments (AC, H, and I). Source data are provided as a Source Data file.
Fig. 5
Fig. 5. Acrolein hinders necroptosis via targeting MLKL oligomerization.
A, B Immunoblot analysis of mixed lineage kinase domain-like pseudokinase (MLKL) oligomers by detecting total MLKL (tMLKL) in non-reducing condition and immunoblot analysis of phosphorylated MLKL (pMLKL) and tMLKL in bone marrow-derived macrophages (BMDMs) after indicated treatments. The single asterisk (*) indicates the band for potential higher molecular weight aggregates and the double asterisks (**) indicate the band for reduced monomer of MLKL. TSZ [murine TNF, Smac-mimetic and Z-VAD-FMK (zVAD)], necrostatin-1 (Nec-1), dithiothreitol (DTT), acrolein (Acr), and ferrostatin-1 (Fer-1) were used. β-actin was used as an internal control. C Real-time analysis of cell death of BMDMs with TSZ as described in the presence of GSK’872 (GSK) or Acr combined with Fer-1. D Immunoblot analysis of MLKL oligomers by detecting total MLKL under non-reducing conditions and immunoblot analysis of pMLKL and tMLKL in TSZ (human TNF, Smac-mimetic, and zVAD)-treated HT-29 cells with or without Nec-1 and Acr. E, F Real-time analysis of cell death in TSZ-treated (E) HT-29 cells and (F) CT-26 cells with or without Acr and Nec-1. G Representative images of MLKL immunofluorescence in TSZ-treated L929 cells and HT-29 cells as described in the presence or absence of Acr. White arrowheads indicate MLKL puncta. H Real-time analysis of cell death in RIPK3-expressing HeLa cells exposed to N1,N11-diethylnorspermine (DENSPM), genetically modified using CRISPR-Cas9 with either a non-targeting scramble guide RNA (Scr) or SAT1-specific guide RNAs (SAT1−/− #g1 and SAT1−/− #g2), treated with TSZ (human TNF, Smac-mimetic BV-6 and zVAD) in the presence or absence of Nec-1. Nec-1, GSK, Fer-1, and Acr were pretreated before TSZ stimulation. BV-6 was used in experiments where specifically noted. Data are representative of at least three independent experiments (A, B, D, and G). Data are shown as mean ± SEM; ****P < 0.0001 (two-way ANOVA; n = 4 from 4 biologically independent samples) (C, E, F, and H). Scale bar, 20 μm (G). Source data are provided as a Source Data file.
Fig. 6
Fig. 6. The acrolein scavenger Hydralazine enhances chemotherapeutic efficacy.
A Percentage of cell death in CT-26 cells at 48 h after stimulation with one or more of the following: 4-hydroperoxycyclophosphamide (4HC), Z-VAD-FMK (zVAD), hydralazine (HZ), and necrostatin-1 (Nec-1). B Mean tumor volume in wild-type (WT) Balb/c mice 10 days after CT-26 cancer cells engraftment, treated with a vehicle, hydralazine (HZ), cyclophosphamide (CP), or CP plus HZ. Mice were treated with CP and/or HZ every 2 days until sacrificed. C Representative images of hematoxylin and eosin staining in necrotic (top row) and viable (middle row) tumor regions, immunohistochemical staining of phosphorylated mixed lineage kinase domain-like pseudokinase (pMLKL, bottom row), and quantification of necrotic areas or pMLKL-positive cells per high-power field (HPF). Each dot represents mean necrotic area or pMLKL-positive cells per mouse. D Mean tumor volume in WT Balb/c nude mice 12 days after HT-29 cancer cells engraftment, treated with vehicle, HZ, CP, or CP plus HZ. Mice were treated with CP and/or HZ every 2 days until sacrificed. E Schematics depicting the mechanisms by which metabolically-derived or exogenously sourced acrolein inhibits necroptosis and promotes chemoresistance. Data are shown as mean ± SEM (AD). ****P < 0.0001 and ***P = 0.0005 (one-way ANOVA; n = 4 from 4 biologically independent samples) (A). ****P < 0.0001 and **P = 0.0024 (two-way ANOVA; n = 10 per group) (B). ****P < 0.0001, ***P = 0.0009, **P = 0.0097 and ns = 0.4714 (one-way ANOVA; n = 8) (C). ****P < 0.0001, **P = 0.0032 for vehicle versus CP and **P = 0.0029 for CP versus CP plus HZ (two-way ANOVA; for vehicle, n = 7 and others, n = 8 per group) (D). Scale bars, 100 μm for hematoxylin and eosin staining and 50 μm for immunohistochemical staining. Source data are provided as a Source Data file.

References

    1. Newton, K., Strasser, A., Kayagaki, N. & Dixit, V. M. Cell death. Cell187, 235–256 (2024). - PubMed
    1. Lee, E., Song, C. H., Bae, S. J., Ha, K. T. & Karki, R. Regulated cell death pathways and their roles in homeostasis, infection, inflammation, and tumorigenesis. Exp. Mol. Med.55, 1632–1643 (2023). - PMC - PubMed
    1. Man, S. M. & Kanneganti, T. D. Innate immune sensing of cell death in disease and therapeutics. Nat. Cell Biol.26, 1420–1433 (2024). - PubMed
    1. Shi, J. et al. Cleavage of GSDMD by inflammatory caspases determines pyroptotic cell death. Nature526, 660–665 (2015). - PubMed
    1. Rogers, C. et al. Cleavage of DFNA5 by caspase-3 during apoptosis mediates progression to secondary necrotic/pyroptotic cell death. Nat. Commun.8, 14128 (2017). - PMC - PubMed