

Real-time imaging of blood coagulation and angiogenesis during development in a zebrafish model of type I antithrombin deficiency
- PMID: 40425635
- PMCID: PMC12117160
- DOI: 10.1038/s41598-025-01658-z
Real-time imaging of blood coagulation and angiogenesis during development in a zebrafish model of type I antithrombin deficiency
Abstract
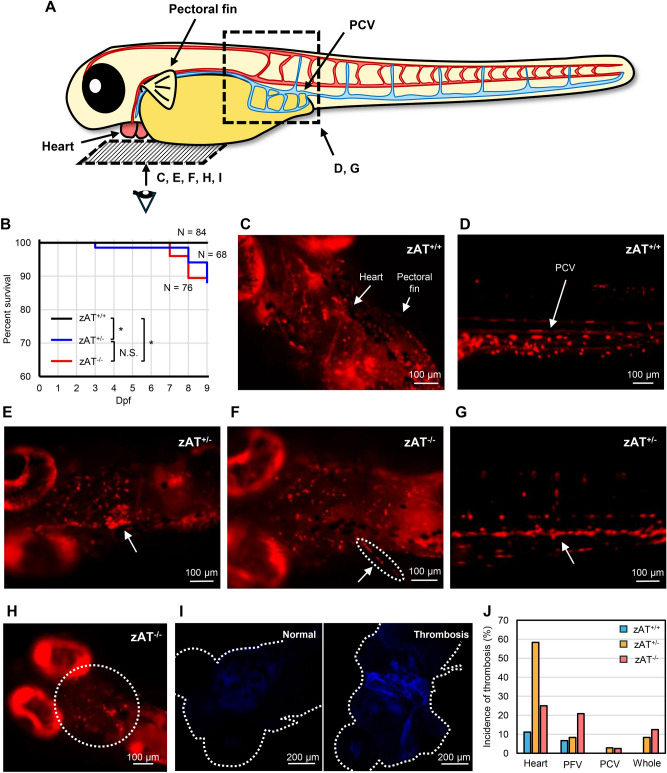
Severe type I antithrombin (AT) deficiency is considered to cause embryonic lethality. Although several pathological analyses using mice or zebrafish have been attempted, the previous studies did not unveil the detailed mechanism leading to lethality in the early developmental stage. In order to solve this problem, we established type I AT deficient zebrafish by the CRISPR/Cas9 system into Tg(gata1:dsRed) and Tg(fli1a:GFP) lines, so that we could conduct real-time imaging of thrombosis and angiogenesis using fluorescence stereo zoom microscopy. The established zebrafish AT (zAT) mutants harbored frameshift mutations which resulted to be type I AT deficient, unable to secrete zAT protein into blood. Both heterozygous (zAT+/-) and homozygous (zAT-/-) mutants showed reduced survival rate and diverse thrombosis up to 9 days post fertilization. In addition, blood vessel formation was delayed at 30 hpf in zAT-/-, which was recovered normally by 5 dpf and had little effect on survival. Notably, we analyzed the differences in gene expression profiles under AT-depleted conditions by real-time quantitative PCR, and zAT-/- juvenile zebrafish showed increased PLG gene expression and decreased F2 gene expression. Our in vivo study revealed the effects of AT deficiency on embryos during development from the aspects of coagulation and vascular formation.
Keywords: Angiogenesis; Antithrombin deficiency; Genome editing; Thrombosis; Zebrafish.
© 2025. The Author(s).
Conflict of interest statement
Declarations. Competing interests: The authors declare no competing interests.
Figures


Similar articles
-
Characterization of Sry-related HMG box group F genes in zebrafish hematopoiesis.Exp Hematol. 2011 Oct;39(10):986-998.e5. doi: 10.1016/j.exphem.2011.06.010. Epub 2011 Jul 1. Exp Hematol. 2011. PMID: 21726513
-
Etv2 and fli1b function together as key regulators of vasculogenesis and angiogenesis.Arterioscler Thromb Vasc Biol. 2015 Apr;35(4):865-76. doi: 10.1161/ATVBAHA.114.304768. Epub 2015 Feb 26. Arterioscler Thromb Vasc Biol. 2015. PMID: 25722433 Free PMC article.
-
[Natriuretic peptide precursor C coding gene contributes to zebrafish angiogenesis].Sheng Li Xue Bao. 2017 Feb 25;69(1):11-16. Sheng Li Xue Bao. 2017. PMID: 28217803 Chinese.
-
Models to investigate intussusceptive angiogenesis: A special note on CRISPR/Cas9 based system in zebrafish.Int J Biol Macromol. 2019 Feb 15;123:1229-1240. doi: 10.1016/j.ijbiomac.2018.11.164. Epub 2018 Nov 22. Int J Biol Macromol. 2019. PMID: 30468812 Review.
-
Insights in vessel development and vascular disorders using targeted inactivation and transfer of vascular endothelial growth factor, the tissue factor receptor, and the plasminogen system.Ann N Y Acad Sci. 1997 Apr 15;811:191-206. doi: 10.1111/j.1749-6632.1997.tb52002.x. Ann N Y Acad Sci. 1997. PMID: 9186598 Review.
References
-
- Corral, J., de la Morena-Barrio, M. E. & Vicente, V. The genetics of antithrombin. Thromb. Res.169, 23–29 (2018). - PubMed
-
- O’Reilly, M. S., Pirie-Shepherd, S., Lane, W. S. & Folkman, J. Antiangiogenic activity of the cleaved conformation of the serpin antithrombin. Science285, 1926–1928 (1999). - PubMed
-
- Larsson, H. et al. A novel anti-angiogenic form of antithrombin with retained proteinase binding ability and heparin affinity. J. Biol. Chem.276(15), 11996–12002 (2001). - PubMed
MeSH terms
Substances
Grants and funding
LinkOut - more resources
Full Text Sources
Molecular Biology Databases
Miscellaneous
