. 2025 May 27;8(1):817.
doi: 10.1038/s42003-025-08203-8.

Proteomic surveys of the mouse heart unveil cardiovascular responses to nitric oxide/cGMP signaling deficiencies

Affiliations

Proteomic surveys of the mouse heart unveil cardiovascular responses to nitric oxide/cGMP signaling deficiencies

Ipsita Mohanty et al. Commun Biol. .

Abstract

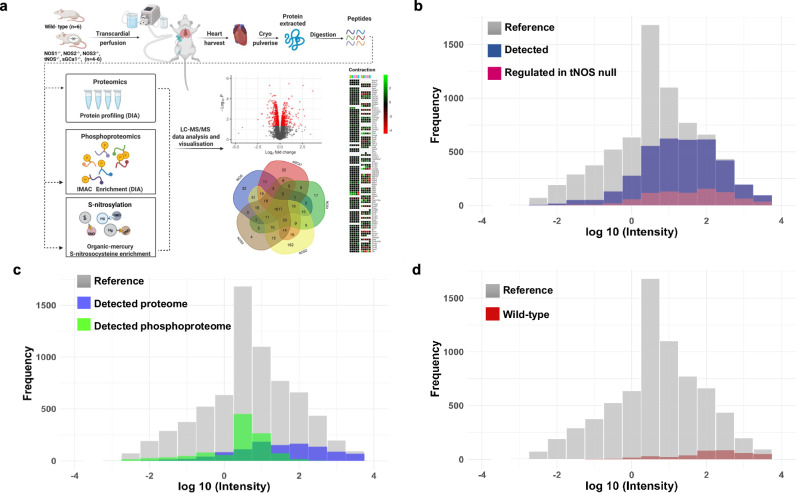
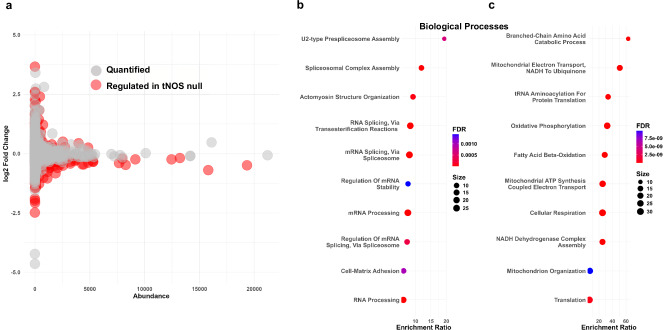
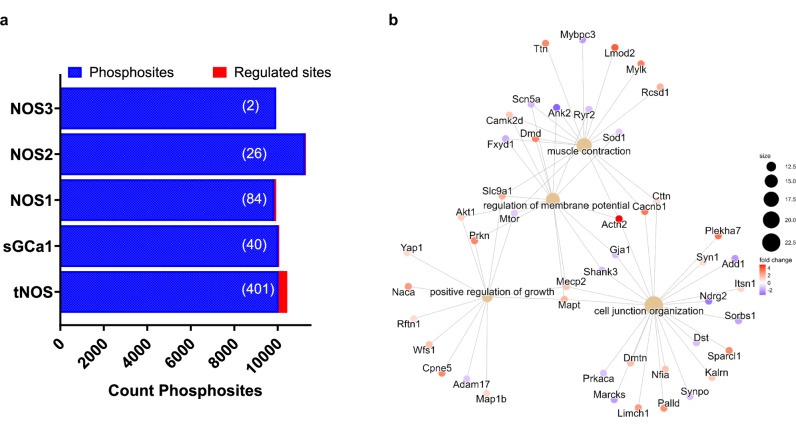
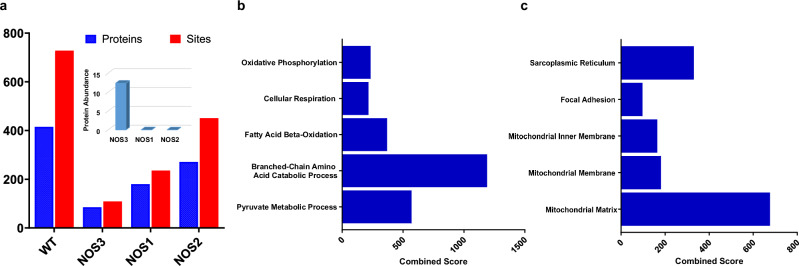
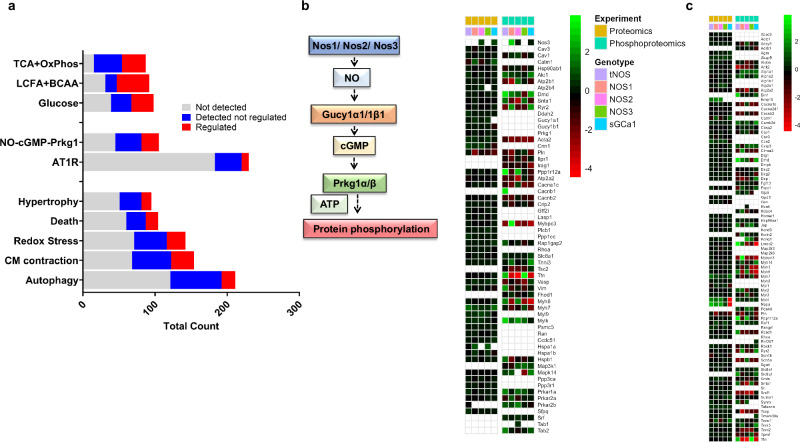
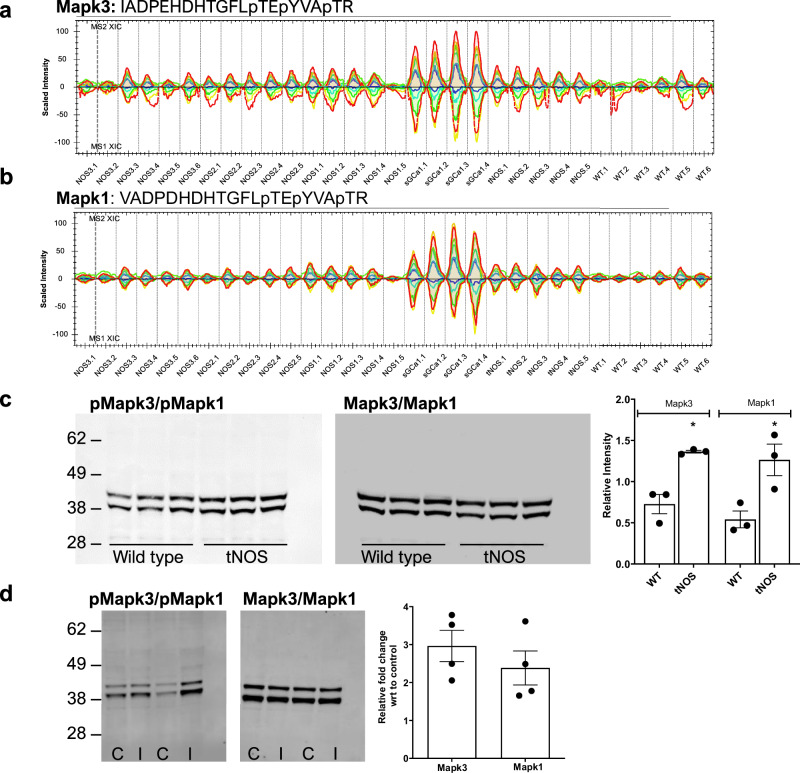
Diminished bioavailability of nitric oxide (NO) contributes to the pathogenesis of cardiometabolic disorders. However, the alterations in signaling under NO deficiency remain mostly unknown. We combined genetics and proteomics to quantify changes in the heart proteome, phosphoproteome, and S-nitrosocysteine proteome in mice lacking nitric oxide synthases (NOS1, NOS2, NOS3), lacking all three enzymes (tNOS), or the alpha 1-regulatory subunit of the soluble guanylate cyclase (sGCα1). Modest changes of less than 1% in the proteome and 4% in the phosphoproteome in single NOS gene or sGCα1 null mouse hearts indicate sufficient biological compensation. In contrast, the number of S-nitrosylated proteins declined by 80%, 57%, and 35% in NOS3, NOS1, and NOS2 null mice, respectively. A 21% remodeling of the proteome and 9% of the phosphoproteome in the tNOS null mice included integral kinases that provide adaptive rewiring of signaling. The data revealed the emergence of enhanced mitogen-activated-kinases Mapk3/Mapk1 signaling, documented by increased phosphorylation of these kinases and their downstream targets. The data highlight that adaptive compensation of signaling prevents overt phenotypes during NO signaling deficits. In contrast, maladaptive signaling via Mapk3/Mapk1 may promote pathological cardiomyopathy that progressively develops in the tNOS null mice.


Conflict of interest statement

Competing interests: The authors declare no competing interests.

Figures

Fig. 1
Fig. 1. Proteomic landscapes of the male mouse heart.
a Graphical representation of the experimental workflow for the acquisition, identification, quantification, and bioinformatic analysis of mouse heart proteome, phosphoproteome, and S-nitrosocysteine proteomes. The figure was created using BioRender (license to Mohanty, I., 2024, https://biorender.com/z60z971), and the data images were generated from our proteomic analysis. b Histogram plot of the relative abundance of the 3,663 proteins quantified in all genotypes (purple) and 816 that are statistically different in the tNOS null mice, adjusted p-value < 0.05 (red). The proteome was acquired from n = 5 wild-type, n = 4 NOS1, n = 5 NOS2, n = 5 NOS3, n = 4 sGCα1 and n = 5 tNOS null mice. The gray bars represent the distribution of the manually curated and integrated reference mouse heart proteome of 7071 proteins. c Histogram of the relative abundance of phosphoproteins detected in all genotypes. 1064 proteins were identified only by the phosphorylation site (light green), whereas 1072 were detected in the proteome and phosphoproteome (blue). The phosphoproteome was acquired from n = 5 wild-type, n = 4 NOS1, n = 5 NOS2, n = 5 NOS3, n = 4 sGCα1 and n = 5 tNOS null mice. d Cumulative frequency histogram of the relative abundance of 415 S-nitrosylated proteins (red) in the wild-type mouse, n = 6.
Fig. 2
Fig. 2. Alterations in the mouse heart proteome.
a A scatter MA plot depicting on the X-axis the relative abundance and Y-axis the log2 fold change of the 3979 proteins quantified in tNOS (n = 5) and wild type (n = 5) mice. The 816 significantly different proteins in the tNOS null mice hearts are depicted in red. b Biological processes enriched in the 366 proteins with increased relative levels in the hearts of tNOS mice compared to wild type. c Biological processes enriched in the 450 proteins, in which the relative levels were decreased in tNOS compared to wild-type mice. The X-axis indicates the enrichment ratio, the size of the circles indicates the number of proteins in the cluster, and the color heat bar indicates the false discovery rate values (FDR) of enrichment.
Fig. 3
Fig. 3. Changes in the phosphoproteome of the male mouse heart.
a Bars represent the number of phosphosites detected in each genotype (n = 5 wild-type, n = 4 NOS1, n = 5 NOS2, n = 5 NOS3, n = 4 sGCα1, and n = 5 tNOS null mice). The number of significantly different from wild-type (adjusted p-value < 0.05) regulated sites is indicated in red and in parentheses. b Gene ontology enrichment analysis of the 161 phosphoproteins with 401 regulated phosphosites in the tNOS null mice. The data depicts four major enriched biological processes. The size of the circles indicates the number of proteins in the cluster, and the color bar signifies the fold change from the wild-type mice.
Fig. 4
Fig. 4. Analysis of the cysteine S-nitrosylation proteome.
a The bars indicate the number of precisely identified S-nitrosocysteine sites (red) and the corresponding proteins (blue) for each genotype (n = 6 wild-type, n = 6 NOS1, n = 6 NOS2, n = 6 NOS3, null mice). Insert indicates the relative abundance levels of the NOS isoforms in the mouse heart. b Gene Ontology analysis for biological processes enriched in the 336 proteins that are S-nitrosylated in wild-type but not in NOS3 mouse hearts. The X-axis indicates the combined score, the natural log of the p-value multiplied by the z-score, where the z-score is the deviation from the expected rank from the Enrichr analysis. c The same as b for the cellular component, indicating the localization of the proteins.
Fig. 5
Fig. 5. Pathway-specific analysis in the tNOS null mice.
a Manually curated sub-proteomes for major functional pathways were used to identify proteins, and phosphoproteins detected and/or regulated in the tNOS null mice. The number of regulated proteins includes S-nitrosylated proteins in the wild-type hearts, which are missing in the tNOS null mice. b Graphical depiction of the canonical signaling cascade of NO/cGMP that includes downstream targets of Prkg1 phosphorylation and a heat map depicting changes in the proteome and phosphoproteome in this pathway for all genotypes. c Heat map depicting changes in the proteome and phosphoproteome for the cardiomyocyte contraction pathway. White boxes indicate that the protein or the phosphoprotein was not detected.
Fig. 6
Fig. 6. Regulated kinases and phosphatases in the tNOS mice hearts.
a We generated reference lists of 295 and 116 putative kinases expressed in mouse hearts by curating data from available resources. In the proteome, phosphoproteome, and S-nitrosocysteine proteome, we assess changes in 49% of the putative kinases and 35% of the phosphatases expressed in the heart. b Kinases that were significantly regulated (adjusted p-value < 0.05) at the proteome level. c Fold changes in the relative abundance of phosphosites in kinases. Phosphosites Slk_T1931, Speg_S1954, and Speg_T1956 were below the detection level in tNOS null mice. The relative levels of Stk, Camk2d, and Akt1 were also regulated at the protein level.
Fig. 7
Fig. 7. Adaptive responses in NO/cGMP deficiency.
a MS and MS/MS extracted ion chromatograms (XIC) for the Mapk3 peptide IADPEHDHTGFLpTEpYVApTR and b for the Mapk1 peptide VADPDHDHTGFLpTEpYVApTR. In both graphs, the top tracings are the MS2, and the bottom are the MS1 XIC. These peptides correspond to the three phosphorylation sites in the Thr-Glu-Tyr-X-X-Thr motif of the activation loops, corresponding to Thr203, Tyr205, and Thr208 in Mapk3, and Thr183, Tyr185, and Thr188 in Mapk1 across all genotypes. c Western blot for phosphorylated and total Mapk3 and Mapk1 in the tNOS and wild-type mouse hearts (n = 3). Quantification of the ratio of phosphorylated to total Mapk3 and Mapk1 from three different mouse hearts (values represent mean ± standard deviation). Total Mapk3 and Mapk1 levels were normalized to GAPDH. *p value = 0.0056 for Mapk3 and p value = 0.0292 for Mapk1. d Representative western blots and quantification of the fold increase in the ratio of phosphorylated to total Mapk3 and Mapk1 in HL-1 cells after inhibition of NOS and sGC. (C) indicates no treatment control, and (I) treatment with the NOS inhibitor L-NAME and the sGC inhibitor ODQ (n = 4 independent cell cultures and treatments, values represent mean ± standard deviation).

References

    1. Furchgott, R. F. The 1996 Albert Lasker Medical Research Awards. The discovery of endothelium-derived relaxing factor and its importance in the identification of nitric oxide. JAMA276, 1186–1188 (1996). - PubMed
    1. Murad, F. Shattuck Lecture. Nitric oxide and cyclic GMP in cell signaling and drug development. N. Engl. J. Med.355, 2003–2011 (2006). - PubMed
    1. Ignarro, L. J. Nitric oxide: a unique endogenous signaling molecule in vascular biology. Biosci. Rep.19, 51–71 (1999). - PubMed
    1. Moncada, S. & Higgs, E. A. The discovery of nitric oxide and its role in vascular biology. Br. J. Pharmacol.147, S193–S201 (2006). - PMC - PubMed
    1. Lundberg, J. O., Gladwin, M. T. & Weitzberg, E. Strategies to increase nitric oxide signaling in cardiovascular disease. Nat. Rev. Drug Discov.4, 623–641 (2015). - PubMed

LinkOut - more resources