. 2025 Oct;9(10):1656-1676.
doi: 10.1038/s41551-025-01394-9. Epub 2025 May 27.

A wireless device for continuous measurement of brain parenchymal resistance tracks glymphatic function in humans

Affiliations

A wireless device for continuous measurement of brain parenchymal resistance tracks glymphatic function in humans

Paul Dagum et al. Nat Biomed Eng. 2025 Oct.

Abstract

Glymphatic function in animal models supports the clearance of brain proteins whose mis-aggregation is implicated in neurodegenerative conditions including Alzheimer's and Parkinson's disease. The measurement of glymphatic function in the human brain has been elusive due to invasive, bespoke and poorly time-resolved existing technologies. Here we describe a non-invasive multimodal device for the continuous measurement of sleep-active changes in parenchymal resistance in humans using repeated electrical impedance spectroscopy measurements in two separate clinical validation studies. Device measurements successfully paralleled sleep-associated changes in extracellular volume that regulate glymphatic function and predicted glymphatic solute exchange measured by contrast-enhanced MRI. We replicate preclinical findings showing that glymphatic function is increased with increasing sleep electroencephalogram (EEG) delta power and is decreased with increasing sleep EEG beta power and heart rate. The present investigational device permits the continuous and time-resolved assessment of parenchymal resistance in naturalistic settings necessary to determine the contribution of glymphatic impairment to risk and progression of Alzheimer's disease and to enable target-engagement studies that modulate glymphatic function in humans.


Conflict of interest statement

Competing interests: P.D., L.G., S.R.L., J.W., T.S., M.M.L. and J.J.I. declare the existence of financial and stock options. Y.C. and R.M.K. declare the existence of financial competing interests.

Figures

Fig. 1
Fig. 1. Effect of glymphatic function on parenchymal resistance analysed via dynamic impedance spectroscopy.
a, Glymphatic function involves the influx of cerebrospinal fluid along perivascular spaces surrounding penetrating arteries (centre). Glymphatic flow is driven by arterial pulsation, vasomotor oscillations and synchronous neural activity (right). Astrocytic endfoot processes create the barrier between the PVS and the brain parenchyma, with gaps allowing CSF to exchange through the brain interstitial space. The arrows represent cerebrospinal fluid flow along the perivascular spaces and into the brain interstitial space. b, Data from physiological studies in rodents suggest that glymphatic function is increased in conditions of reduced heart rate, increased vasomotor pulsations, reduced EEG beta power and increased EEG delta power. c, The interstitial space is dynamically regulated. Under conditions common to the awake state, it is narrow and tortuous, forming a high-resistance pathway that suppresses glymphatic flow. When alternating current is injected into the brain parenchyma, at low frequencies the current cannot penetrate the cell membranes and its propagation depends primarily on the resistive pathway of the interstitial fluid. At high current frequencies, the current readily penetrates the cell membranes and its propagation depends on the resistance of the total tissue volume. This frequency difference is the β-dielectric dispersion of the underlying tissue. A change in the dielectric dispersion reflects a change in the low-frequency resistance pathway of the interstitial fluid. d, In the sleep state, fluid shifts from the intracellular compartment into the interstitial space, enhancing glymphatic function by ~60% in rodent studies. This widening of interstitial pathways reduces the current resistance at low frequencies, which reduces the measured dielectric dispersion. e, An impedance–frequency graph shows the change in dielectric dispersion between the two sleep/wake states. The change in parenchymal resistance between these two states is inversely proportional to the relative change in the dielectric dispersion. f, Contrast-enhanced MRI following intravenous GBCA injection shows vascular regions that enhance immediately (t = 30 min) upon GBCA injection (red), and CSF and brain parenchymal regions that enhance late (t = 3 h) after leakage of GBCA first into the CSF and then into the brain interstitium (green). A given MRI voxel includes GBCA within the blood, CSF and brain interstitial fluid compartments. Illustrations: Applied Cognition.
Fig. 2
Fig. 2. Technical schematic of investigational device and its output signals.
Data for this study were acquired with a non-invasive multimodal skin-interfaced wireless device for continuous measurement of brain parenchymal resistance using repeated EIS time multiplexed with EEG and cardiovascular measurements. EEG differential measurements were made between the two in-ear electrodes, and a left mastoid was used to drive the common mode. These electrodes were shared with the EIS, and the two measurements were time multiplexed with a pair of analogue multiplexers that decoupled EEG and EIS. The transcranial multifrequency alternating current injections created an electric field through the brain and orthogonal equipotential surfaces. a, Each in-ear electronics houses PPG and IMU sensors. b, Data from the sensors are stored on the device’s FLASH memory and transferred via a USB port to a cloud signal processing pipeline for offline analysis. Data from a participant visit is shown, which includes the device EEG periodogram and hypnogram. c, The EIS resistance and reactance frequency plots for this participant reveal an approximate 2,000 mOhm change in the dielectric dispersion during the sleep visit. d, The IPG respiratory and cardiac impedance variations are 120 mW and 50 mW, respectively. e, Cardiac ejection of blood is detected by the in-ear IMUs in the ballistocardiogram. The J peak of the ballistocardiogram marks the aortic valve opening. f, Time delay between the ballistocardiogram and in-ear PPG measures the pulse-transit time (PTT) to the ear. Illustrations: Applied Cognition.
Fig. 3
Fig. 3. Study schematic and CONSORT diagram for Benchmarking Study and Replication Study.
a, The Benchmarking Study conducted at The Villages was designed to define the relationship between parenchymal resistance (RP) and glymphatic function. Reported here are the overnight and morning device recordings, overnight and morning gold-standard PSG, and morning CE-MRI following intravenous GBCA administration as a measure of glymphatic function. Primary and secondary outcome data not reported here included blood analysis of amyloid β and tau levels, cognitive assessment and non-contrast MRI. b, The Replication Study conducted at the University of Washington had a primary outcome of confirming the effect of sleep state on device-measured RP, and secondary outcomes of confirming the associations between RP and sleep stages, heart rate and EEG spectral band power. The Replication Study also included secondary outcomes on blood analyses for amyloid β and tau levels, cognitive assessment and non-contrast MRI. c, The Benchmarking Study enrolled 34 participants of which 30 completed both visits. Three were censored due to changes in device data collection and sensor locations. One withdrew following the first MRI scan. Of the 30 that completed the study, 5 overnight sleep visits and 8 overnight wake visits failed the data quality control (QC) criteria to provide sufficient artefact-free data to yield results. This resulted in 25 sleep and 22 wake device, PSG and MRI complete datasets. Of these, 20 sleep and 21 wake device participants had complete data from both the overnight and morning sleep/wake periods. The Replication Study enrolled 14 participants. All 14 completed the study, of which 2 wake visits failed the data QC criteria and no sleep visit failed. Sleep op, sleep opportunity.
Fig. 4
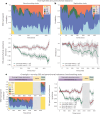
Fig. 4. Brain parenchymal resistance is reduced during periods of sleep.
a, Averaged EEG hypnograms from the sleep condition are shown for the overnight period of the Benchmarking Study with WASO excluded in both the hypnograms and sleep RP (top). Over that period, parenchymal resistance (RP, bottom) remained constant during the awake state (red) but declined gradually in the sleep state (green). b, Similar trends were observed in the Replication Study. c, During the morning period of the Benchmarking Study, participants underwent a 1.5 h sleep opportunity or period of wakefulness. Left: averaged EEG hypnograms for the overnight and morning periods. Right: during the morning awake period, RP increased gradually (dashed red), while it declined gradually during the sleep state (dashed green). Parenchymal resistances RP shown in a, b and c are the average across the participants after normalizing each participant’s RP measurements by their value at onset of the sleep or wake period. RP in c for morning wake is plotted starting at the ending value of overnight RP for illustration purposes. Standard error of the mean is shown for each plot in light grey. The combined overnight and morning Benchmarking Study (c) includes participants whose overnight and morning data passed quality controls.
Fig. 5
Fig. 5. Effect of sleep stages on RP.
The mean first-order difference ΔRP is shown by sleep stage and study for the overnight sleep period with 95% CIs. During N2, N3 and REM sleep, ΔRP is negative for each study and when combined reaches significance. Benchmarking Study N2 (mean: −3.21; 95% CI: −9.07, −0.33; P = 0.113, n = 22), N3 (mean: −9.07; 95% CI: −17.04, −3.75; P = 0.005, n = 14), REM (mean: −8.01; 95% CI: −25.64, −1.18; P = 0.133, n = 18). Replication Study N2 (mean: −12.46; 95% CI: −34.94, −1.49; P = 0.115, n = 10), N3 (mean: −16.04; 95% CI: −25.32, −5.32; P = 0.002, n = 5), REM (mean: −16.24; 95% CI: −42.19, −4.65; P = 0.065, n = 9). Combined N2 (mean: −6.10; 95% CI: −14.78, −1.71; P = 0.04, n = 32), N3 (mean: −10.91; 95% CI: −17.35, −5.93; P < 0.001, n = 19), REM (mean: −10.75; 95% CI: −23.86, −3.91; P = 0.023, n = 27). Sample sizes for plotted Benchmarking, Replication and Combined Study CIs for W are n = 13, 5 and 18, respectively. Sample sizes for plotted Benchmarking, Replication and combined study CIs for N1 are n = 18, 7 and 25, respectively. Units of ΔRP are mΩ. CIs and two-sided P values without adjusting for multiple comparisons were computed using 1,000 bootstrap replications. CIs used the bias-corrected and accelerated (BCa) method, and P values were computed from the Z-score assuming a standard normal distribution.
Fig. 6
Fig. 6. Brain parenchymal resistance is increased by large changes in EEG beta power and reduced by large changes in EEG delta power.
a, Threshold linear mixed regression model of RP against EEG delta and beta power for REM and NREM sleep shown with standard error after differencing both RP and powerband values to make data stationary, standardizing the ΔRP and Δ powerband values to zero mean and unit standard deviation, and adjusting for site, age, gender, APOE4 and site–age interaction confounders. Units of ΔRP and Δ powerband are in standard deviations. Data in light blue are inside the change points and data in dark blue are outside the change points. When delta and beta power changes between successive measurements exceed 1.0 to 1.5 stand deviations, we observe significant changes in ΔRP. b, 95% CIs of regression coefficients show that large changes in REM delta, theta and beta, and NREM delta and beta are significant predictors of ΔRP. For a 1s.d. increase in Δ powerband, an increase (decrease) in ΔRP is illustrated in red (green) with units along the top in standard deviation of ΔRP. c, Large changes in beta and delta powerbands at sleep–wake and NREM–REM transitions show significant effect on ΔRP consistent with the step change in beta and delta power at these transitions. For a 1s.d. increase in Δ powerband across a sleep–wake or NREM–REM transition, an increase (decrease) in ΔRP is illustrated in red (green) with units along the top in standard deviation of ΔRP.

References

    1. Iliff, J. J. et al. A paravascular pathway facilitates CSF flow through the brain parenchyma and the clearance of interstitial solutes, including amyloid β. Sci. Transl. Med.4, 147ra111 (2012). - PMC - PubMed
    1. Xie, L. et al. Sleep drives metabolite clearance from the adult brain. Science342, 373–377 (2013). - PMC - PubMed
    1. Iliff, J. J. et al. Impairment of glymphatic pathway function promotes tau pathology after traumatic brain injury. J. Neurosci.34, 16180–16193 (2014). - PMC - PubMed
    1. Harrison, I. F. et al. Impaired glymphatic function and clearance of tau in an Alzheimer’s disease model. Brain143, 2576–2593 (2020). - PMC - PubMed
    1. Ishida, K. et al. Glymphatic system clears extracellular tau and protects from tau aggregation and neurodegeneration. J. Exp. Med.219, e20211275 (2022). - PMC - PubMed

LinkOut - more resources