. 2025 May 27;9(1):156.
doi: 10.1038/s41698-025-00946-1.

Optimized culturing yields high success rates and preserves molecular heterogeneity, enabling personalized screening for high-grade gliomas

Affiliations

Optimized culturing yields high success rates and preserves molecular heterogeneity, enabling personalized screening for high-grade gliomas

Cassandra Posthoorn-Verheul et al. NPJ Precis Oncol. .

Abstract

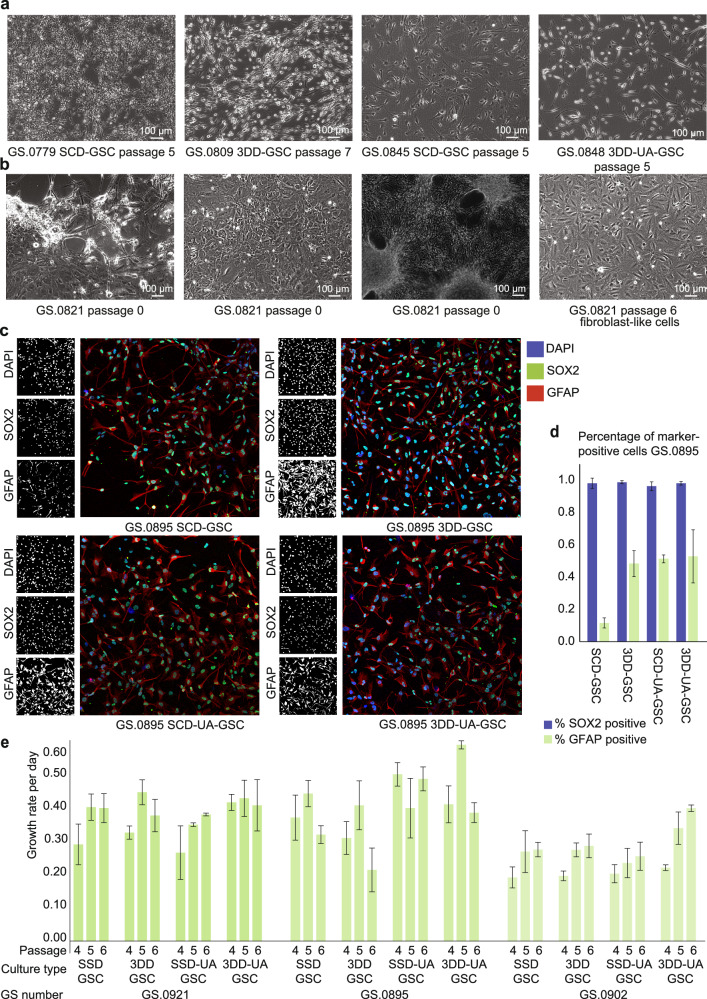
To discover new treatment options for high-grade glioma (HGG), robust in vitro models are essential, but reliably establishing patient-derived cell cultures remains challenging. We established glioma stem-like cell (GSC) cultures from 114 consecutive HGG specimens via traditional surgical resection and/or ultrasonic aspiration, using completely dissociated single cell (single cell-derived, SCD) and partially dissociated 3D-derived (3DD) tissue fragments. Higher success rates in culture establishment were obtained from ultrasonic aspirates and 3DD surgical samples. Combining these approaches yielded a 96% success rate. Copy number profiling showed overall genetic similarities between cultures and parental tissue. Single-cell sequencing revealed greater transcriptomic heterogeneity in ultrasonic aspiration-derived cultures. Our protocol enabled the screening of 20 anti-cancer agents within a clinically relevant timeframe for 16 out of 18 HGG samples. This refined protocol serves as a robust tool for establishing HGG cell cultures that retain the molecular characteristics of the tumors and support applications in precision medicine.


Conflict of interest statement

Competing interests: The authors declare no competing interests.

Figures

Fig. 1
Fig. 1. Graphical representation of the tumor processing protocol.
In the operating room, tumor tissue is resected as solid pieces of tissue (step 1) or with UA (step 1). The tissue is mechanically dissociated using a scalpel (step 2) to fragments ranging in size from 0.5–3 mm. In the case of UA-samples, only the largest fragments are mechanically dissociated. Necrotic tissue, large blood vessels, and blood clots are removed. The fragments are then transferred to a 50 ml Falcon tube containing DMEM supplemented with Collagenase A and DNAse. The tubes are placed in a water bath (step 3) on a shaker for 15–30 min. Next, the suspension is passed over a 70 μm strainer (step 4). The multicellular tissue fragments that remain on top of the filter are then transferred to a separate tube. A lysis buffer is added to remove red blood cells (step 5). Finally, the pellets are washed and transferred to uncoated culture flasks in serum-free culture medium (step 6).
Fig. 2
Fig. 2. Success rate of the various arms of the culture protocol.
a Graphical representation of the culture success rate per culture method. Asterisks indicate significance levels (* represents p < 0.05, ** represents p < 0.01) based on the Fisher exact contingency test. For one patient, samples from two separate surgeries were processed for culture (GS.0852 and GS.0921, designated with a hashtag). For another patient, samples from four separate surgeries were processed (GS.0917, GS.0770, GS.0866, and GS.0869, designated with a tilde). b Graphical representation success rate for 23 tumors for which all four parallel arms of the protocol were initiated.
Fig. 3
Fig. 3. Adherent culture morphology can be used to identify GSC-rich cultures.
a Brightfield images of four different representative glioma cultures (Zeiss Axio Observer D1 Inverted Phase Contrast Fluorescence Microscope, 10x magnification). All cultures show an astrocytoma-like phenotype with elongated cell shapes, slim protrusions, small cell bodies, and bright edges. Typically, unless a culture is severely overgrown, there is space between individual cell bodies. The size bar represents 100 μm. b Brightfield images (Zeiss Axio Observer D1 Inverted Phase Contrast Fluorescence Microscope, 10x magnification) of culture GS.0821 at passage 0 and at passage 6. At passage zero, a heterogeneous mix of two cell types can be observed: the astrocytoma-like phenotype and the fibroblast-like phenotype. c Immunofluorescent staining of neuronal stem cell marker SOX2 and GFAP (Leica TCS SP5 microscope). The black and white images show the positive cells for a single marker, the color image shows a composite image. d Percentage of marker-positive cells per arm of the protocol for cell culture GS.0875. Error bars represent differences between three different areas of the same cover slip. e Growth rates of the cultures from the four different arms of the protocol over three consecutive passages for three different tumors. Error bars represent the standard deviation between technical replicates.
Fig. 4
Fig. 4. Genetic analysis of parental tissue and correspondent cell cultures.
a Correlation matrix of sequential parental tissues and derived cell cultures. Color scale is based on the percentage match in SNPs. Blue indicates a high level of similarity, while red indicates a low level of similarity. The type of culture is denoted with colored bars, as indicated in the figure. Two sets, GS.0827 and GS.0837, were IDH1 R132H mutants, and GS.0852 and GS.0921 are a primary-recurrent set. b Average CNV plot for each type of glioma culture. The number of cultures used is noted on the left.
Fig. 5
Fig. 5. Single cell RNA sequencing shows heterogeneous cell populations within cultures.
a Copy number variation (CNV) profiles of the cell cultures GS.0865 (top) and GS.0906 (bottom) subdivided by type of resection and shown across passages. The first colored bar on the left identifies the genetically diverse subclones within each condition. Each condition is depicted on the second colored bar on the left and in the legend. The red color highlights the gains, while the blue color indicates the losses in the chromosomes. b Dotplot showing the expression of glioblastoma hallmark genes of the cell cultures GS.0865 and GS.0906 divided by type of resection and shown across passages. c UMAP plot of single cells transcriptional profiling derived from cells from all tested passages and resection types from GS.0865 (top) and GS.0906 (bottom) cells. Clusters are colored and labeled by HGG-related cellular states (APC astrocyte precursor cells, OPC oligodendrocyte precursor cells, CSC cancer stem cells, Astro astrocyte-like, Oligo oligodendrocyte-like). d Alluvial plot showing the changes in the frequency of tumor cells clusters over time (passages) in GS.0865 3DD-GSC (top, left), GS.0865 3DD-UA-GSC (top, right), and in GS.0906 3DD-GSC (bottom, left), GS.0906 3DD-UA-GSC (bottom, right). e UMAP plot of GS.0865 (left) and GS.0906 (right) single cells across passages, based on the arm of the protocol through which they were derived.
Fig. 6
Fig. 6. Diverse sensitivity to anticancer agents in HGG cell cultures.
The heatmap represents IC50 values, each normalized and scaled for individual drugs, spanning from 0 (minimum value and high sensitivity, yellow) to 1 (maximum value and low sensitivity, dark blue), capturing the relative range of drug concentrations tested. Light gray boxes indicate unavailable data, while dark blue boxes represent IC50 values exceeding the highest tested concentrations.

References

    1. Ostrom, Q. T. et al. CBTRUS Statistical Report: Primary brain and other central nervous system tumors diagnosed in the United States in 2015–2019. Neuro-Oncol.24, v1–v95 (2022). - PMC - PubMed
    1. Patel, A. P. et al. Single-cell RNA-seq highlights intratumoral heterogeneity in primary glioblastoma. Science344, 1396–1401 (2014). - PMC - PubMed
    1. Pesenti, C. et al. The genetic landscape of human Glioblastoma and matched primary cancer stem cells reveals intratumour similarity and intertumour heterogeneity. Stem Cells Int.2019, 1–12 (2019). - PMC - PubMed
    1. Neftel, C. et al. An Integrative model of cellular states, plasticity, and genetics for Glioblastoma. Cell178, 835–849.e821 (2019). - PMC - PubMed
    1. Lee, J. et al. Tumor stem cells derived from glioblastomas cultured in bFGF and EGF more closely mirror the phenotype and genotype of primary tumors than do serum-cultured cell lines. Cancer Cell.9, 391–403 (2006). - PubMed

LinkOut - more resources