. 2025 Jun;57(6):1524-1534.
doi: 10.1038/s41588-025-02202-5. Epub 2025 May 27.

Conservation of regulatory elements with highly diverged sequences across large evolutionary distances

Affiliations

Conservation of regulatory elements with highly diverged sequences across large evolutionary distances

Mai H Q Phan et al. Nat Genet. 2025 Jun.

Abstract

Developmental gene expression is a remarkably conserved process, yet most cis-regulatory elements (CREs) lack sequence conservation, especially at larger evolutionary distances. Some evidence suggests that CREs at the same genomic position remain functionally conserved independent of sequence conservation. However, the extent of such positional conservation remains unclear. Here, we profiled the regulatory genome in mouse and chicken embryonic hearts at equivalent developmental stages and found that most CREs lack sequence conservation. To identify positionally conserved CREs, we introduced the synteny-based algorithm interspecies point projection, which identifies up to fivefold more orthologs than alignment-based approaches. We termed positionally conserved orthologs 'indirectly conserved' and showed that they exhibited chromatin signatures and sequence composition similar to sequence-conserved CREs but greater shuffling of transcription factor binding sites between orthologs. Finally, we validated indirectly conserved chicken enhancers using in vivo reporter assays in mouse. By overcoming alignment-based limitations, we revealed widespread functional conservation of sequence-divergent CREs.


Conflict of interest statement

Competing interests: The authors declare no competing interests.

Figures

Fig. 1
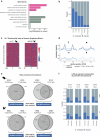
Fig. 1. Evolutionary conservation of gene expression and chromatin structure between mouse and chicken embryonic hearts despite divergent CREs.
a, Reptilian and mammalian lineages convergently evolved fully separated four-chambered hearts. E10.5 and HH22 represent equivalent stages of heart formation. b, Conservation of global gene expression (log2-transformed fold change (FC) of heart-expressed versus limb-expressed genes) between mouse (E10.5) and chicken (HH22). c, ATAC-seq peaks (E10.5 heart) were mostly alignable (LiftOver (minMatch = 0.1)) to chicken in coding but not noncoding regions. d, Syntenic regions at the Hand2/HAND2 locus shows conserved 3D chromatin structure and histone modifications relative to the target gene despite different genomic size. Coverage track unit, counts per million. Dashed triangle indicates conserved topological domain structure, blue circles and dashed rectangle show specific contacts to conserved enhancers. Blue ticks indicate conserved sequences and green or purple ticks indicate predicted promoters or enhancers. e, Signal enrichment (± 3kb) of histone modifications at heart promoters (pro.) and enhancers (enh.) (E10.5, HH22), centered on ATAC-seq summits. f, Fraction of alignable elements identified in e with the chicken or mouse genome (LiftOver (minMatch = 0.1)). Align., alignment; CPM, counts per million. Source data
Fig. 2
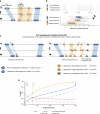
Fig. 2. A synteny-based algorithm, IPP, identifies thousands of putative sequence orthologs of mouse heart CREs.
a, Schematic of the IPP algorithm and its classification of DC, IC and NC features. b, Increase in number of available anchor points in a representative region of the mouse genome using 0, 1 and 14 bridging species. c, IPP increased the number of putative orthologs from mouse in 15 other species used as bridging species (compare blue versus orange portion). LiftOver alignments (top bar) are compared with IPP DC and IC alignments. The increase was particularly high at greater evolutionary distances from nonmammalian species. d, PhastCons77way scores for IPP-defined classes promoters and enhancers. Boxplot shows median and interquartile range of scores of 500-bp windows centered by IPP projections in chicken. Promoter n = 4,461 DC, 9,237 IC, 6,532 NC; enhancer n = 2,588 DC, 10,162 IC, 16,712 NC. d, distance to anchor point. Source data
Fig. 3
Fig. 3. Projections of IC and DC CREs show similar enrichment of functional chromatin marks in the chicken genome.
a, Classification of elements with or without conserved activity (±). Signal enrichment at chicken genomic regions to which mouse CREs were projected. b, Fractions of mouse CRE orthologs (LiftOver: minMatch = 0.1; IPP: DC, IC, NC) overlapping an ATAC-seq peak in chicken HH22/24 hearts. c, Fraction of mouse CRE orthologs (LiftOver: minMatch = 0.1; IPP: DC, IC, NC) overlapping an H3K27ac ChIP–seq peak in opossum adult livers. Source data
Fig. 4
Fig. 4. In silico analysis of sequence composition and motif content of IC and DC elements.
a, Training of an SVM model to identify heart enhancers with independent data from public repositories. Positive set: embryonic heart or cardiomyocyte ATAC-seq peaks; negative set: nonoverlapping ATAC-seq peaks from nonheart tissues. The model distinguishes heart-specific versus limb-specific enhancers from chicken embryos. b, Evaluation of classification of DC+, IC+ and NC regions of the chicken genome by the SVM model. c, TF-MoDISco interpretation of the putative TFBS that contribute to model specificity. Binding sites of several known heart-specific TFs contributed to model accuracy. d, Heart-expressed TFs identified by RNA-seq were consolidated to 301 motifs of heart-specific TFs. Promoter–enhancer pairs were screened for shared TFBS or ATAC-seq footprints. e, DC+IC+ promoters and enhancers shared more heart TFBS than DCIC or NC regions. f, Functionally conserved DC and IC ATAC-seq peak pairs shared more TF footprints than NC ATAC-seq peak pairs or control pairs (‘bg’ indicates a nonpaired ATAC-seq peak in the same TAD). Source data
Fig. 5
Fig. 5. IC heart enhancers from mouse and chicken drive conserved gene expression patterns in vivo.
a, DC and IC enhancers from mouse (top) and chicken (bottom) drive highly similar expression patterns in the hearts of E10.5 embryos. Individual enhancers show similar tissue-restricted or broad expression patterns. Scale bars, 1,000 µm (embryo), 500 µm (heart). b, Sequence conservation scores (phastCons/PhyloP) and direct alignments to human and chicken of the mouse Hand2-DC and Tbx20-IC enhancers tested in a. SVM contribution (Contr.) scores and TF-MoDISco motif matches show conserved sequence features of the 500-bp enhancer highlighting shared TF motif hits overlapping with seqlets. c, The different order of shared TFBS in IC and DC enhancer pairs is reflected by the computed Kendall tau distance, Kd. d, Kd scores for all functionally conserved DC, IC and NC CRE enhancer pairs. Boxplot shows median and interquartile range. Asterisks indicate the magnitude of the effect size based on Cohen’s d (*d < 0.2, small; **d ≤ 0.5, medium); n, number of enhancer pairs. Source data
Extended Data Fig. 1
Extended Data Fig. 1. Conservation of gene expression and 3D chromatin structure in contrast to cis-regulatory element sequences.
(a) Gene Ontology (GO) annotations of differentially expressed genes (Heart vs. FL) in mouse and chicken. Dark pink = upregulated, both species. Dark green = downregulated, both species. Light pink = upregulated, mouse-only. Light green = upregulated, chicken-only. Grey = no differential expression. (b) Estimation of sequence alignability (LiftOver minMatch=0.1) of ATAC-seq peaks from mouse embryonic heart at different annotated genomic locations. (c) Distribution of binarized directionality indices across centred and size-ordered genomic regulatory blocks in mouse and chicken (d) Synteny breakpoints between mouse and human, chicken, zebrafish and Ciona intestinalis genomes relative to the normalized TAD position (e) Number of predicted promoters and enhancers from stage-specific and shared/union sets in both species. (f) Estimation of sequence alignability from stage-specific predicted promoters and enhancers from heart and forelimb (FL) in both species.
Extended Data Fig. 2
Extended Data Fig. 2. Interspecies Point Projection combines bridged alignments and synteny to identify orthologous regions.
(a) Classification of direct and bridged alignments through the use of intermediate species (b) Increase in the number of anchor points and distance to the nearest anchor points through multi-species bridged alignments. Comparison between 0, 1 and 15 bridging species (c) Classifcation of projections as directly and indirectly conserved. DC regions overlap a sequence alignment or are ▯ 300 bp from a direct alignment. The distance of IC regions as >300 bp but ▯ 2.5 kb from a direct or indirect alignment. Regions with >2.5 kb summed distance through the species graph from anchor points are classified as NC. (d) Fractions of mouse enhancers identified as directly conserved (DC, blue) or either directly or indirectly conserved (DC + IC, orange) as a function of the projection score threshold. Fraction of functionally conserved DC + IC elements as a function of the projection score threshold (red). Solid lines = enhancers, dashed lines = randomly selected background regions. Dotted vertical lines represent DC threshold score of 0.979 and IC of 0.841.
Extended Data Fig. 3
Extended Data Fig. 3. Interspecies Point Projection increases detection of putative ortholog regions compared to alignment-based methods.
(a) IPP projections compared to LiftOver determined orthologs using variable minMatch thresholds. (b) Overlap of DC and IC projections with LiftOver-determined orthologs (minMatch=0.1) (c) IPP performance compared to halliftover/HALPER for mouse heart enhancer ortholog prediction in four placental mammals. (d-f) IPP projections for forelimb CREs at E10.5 & E11.5 (d), randomly selected genomic regions and published heart enhancers (Blow et al 2010) (e), adult liver CREs (f). (g) IPP projections for mouse CEBP/A ChIP-seq peaks and number of conserved binding events (as determined by overlap with a CEBP/A ChIP-seq peaks in chicken livers).
Extended Data Fig. 4
Extended Data Fig. 4. Functional and genomic characterization of DC/IC/NC enhancer classes in the mouse genome.
(a) Enrichment of promoter- and enhancer-specific histone modifications and ATAC-seq signal surrounding the distinct enhancer classes in mouse E10.5 heart samples. (b) Fraction of DC/IC/NC CREs overlapping one or multiple experimentally determined TFBSs (ReMap) vs. randomly selected genomic fragments. (c) Distance of enhancers to the nearest annotated TSS for DC/IC/NC enhancers (d) Fraction of enhancers located within annotated genes (and within genes overlapping exons or introns) as well as located in intergenic regions.
Extended Data Fig. 5
Extended Data Fig. 5. Validation of a machine learning model to predict heart specific enhancers across vertebrates.
5 (a) Parameter tuning to train the SVM with RBF kernel with a grid-search for parameters c and gamma showing the calculated AUC after 5-fold cross validation. AUC = Area under the ROC curve. (b) ROC curves with computed AUC showing the performance of gkm-SVM with either RBF(rbf, orange) or weighted RBF(wrbf, blue) kernel on test data. The SVM was trained with the c & gamma parameters chosen in (a). (c) ROC curves with computed AUC showing human-chicken interspecies prediction accuracy for different conservation classes of mouse promoters projected to chicken. (d) Estimation of sequence alignability as a function of SVM predicted tissue-specificity (as prediction score) for ATAC-Seq peaks from chicken embryonic heart. (e) Top 10 mouse (left) and chicken (right) patterns discovered by TF-MoDisco showing seqlet as CWM, trimmed and converted PWMs and their annotated JASPAR motif match.
Extended Data Fig. 6
Extended Data Fig. 6. Genomic location of in vivo tested enhancers in the mouse genome.
(a-g) RNA-, ATAC-seq and ChIPmentation profiles from mouse E10.5 hearts show the distal location of tested IC/DC enhancers in the mouse genome. Scale bar: 50 kb.
Extended Data Fig. 7
Extended Data Fig. 7. In vivo enhancer reporter assays test functional conservation of ortholog enhancer pairs.
(a) Landing pad at the H11 Locus and enhancer targeting plasmid (b) Control Experiment using integration of a non-enhancer plasmid integrated at the H11 locus shows weak background signal in the otic vesicle, somites and the outflow tract at E10.5. (c) Genomic organization of the integrated enhancer-reporter construct at the H11 locus (d) Enhancer-reporter results for Nkx2-5 and Tbx20-IC heart enhancer pairs at E10.5 and 2 adult liver enhancer pairs from mouse and opossum tested in E11.5 embryos. (e) Summary of enhancer activity from all enhancer-reporter assays tested in this study. Scale bar: 1,000 µm (embryo) or 500 µm (heart).
Extended Data Fig. 8
Extended Data Fig. 8. Comparison of ortholog in vivo tested enhancer pairs for their sequence conservation and transcription factor binding site composition.
(a-d) Sequence conservation scores (PhastCons/PhyloP) and direct alignments to human and chicken of tested enhancers at the Tbx20 (a), Pakap (b), Nkx2-5 (c) and Gata4 (d) loci. SVM contribution scores show important sequence features of the 500 bp enhancers in the mouse (top) and chicken (bottom) sequences tested.

References

    1. Irie, N. & Kuratani, S. Comparative transcriptome analysis reveals vertebrate phylotypic period during organogenesis. Nat. Commun.2, 248 (2011). - PMC - PubMed
    1. Berthelot, C., Villar, D., Horvath, J. E., Odom, D. T. & Flicek, P. Complexity and conservation of regulatory landscapes underlie evolutionary resilience of mammalian gene expression. Nat. Ecol. Evol.2, 152–163 (2017). - PMC - PubMed
    1. Olson, E. N. Gene regulatory networks in the evolution and development of the heart. Science313, 1922–1927 (2006). - PMC - PubMed
    1. Visel, A. et al. ChIP-seq accurately predicts tissue-specific activity of enhancers. Nature457, 854–858 (2009). - PMC - PubMed
    1. Villar, D. et al. Enhancer evolution across 20 mammalian species. Cell160, 554–566 (2015). - PMC - PubMed

Substances

LinkOut - more resources