Observational Study
. 2025 Jul;31(7):2430-2441.
doi: 10.1038/s41591-025-03715-6. Epub 2025 May 27.

Feasibility of multiomics tumor profiling for guiding treatment of melanoma

Collaborators, Affiliations
Observational Study

Feasibility of multiomics tumor profiling for guiding treatment of melanoma

Nicola Miglino et al. Nat Med. 2025 Jul.

Erratum in

  • Publisher Correction: Feasibility of multiomics tumor profiling for guiding treatment of melanoma.
    Miglino N, Toussaint NC, Ring A, Bonilla X, Tusup M, Gosztonyi B, Mehra T, Gut G, Jacob F, Chevrier S, Lehmann KV, Casanova R, Jacobs A, Sivapatham S, Boos L, Rahimzadeh P, Schuerch M, Sobottka B, Chicherova N, Yu S, Wegmann R, Mena J, Milani ES, Goetze S, Esposito C, Sarabia Del Castillo J, Frei AL, Nowak M, Irmisch A, Kuipers J, Baciu-Drăgan MA, Ferreira PF, Singer F, Bertolini A, Prummer M, Lischetti U; Tumor Profiler Consortium; Aebersold R, Bacac M, Maass G, Moch H, Weller M, Theocharides APA, Manz MG, Beerenwinkel N, Beisel C, Pelkmans L, Snijder B, Wollscheid B, Heinzelmann V, Bodenmiller B, Levesque MP, Koelzer VH, Rätsch G, Dummer R, Wicki A. Miglino N, et al. Nat Med. 2025 Aug;31(8):2817-2818. doi: 10.1038/s41591-025-03904-3. Nat Med. 2025. PMID: 40750934 Free PMC article. No abstract available.

Abstract

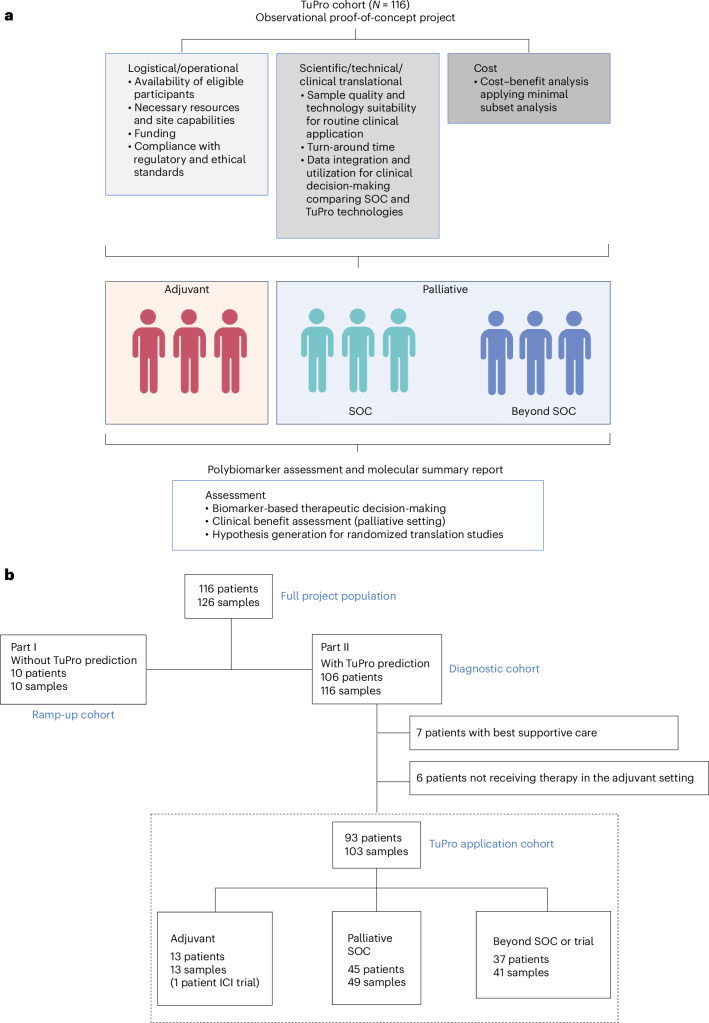
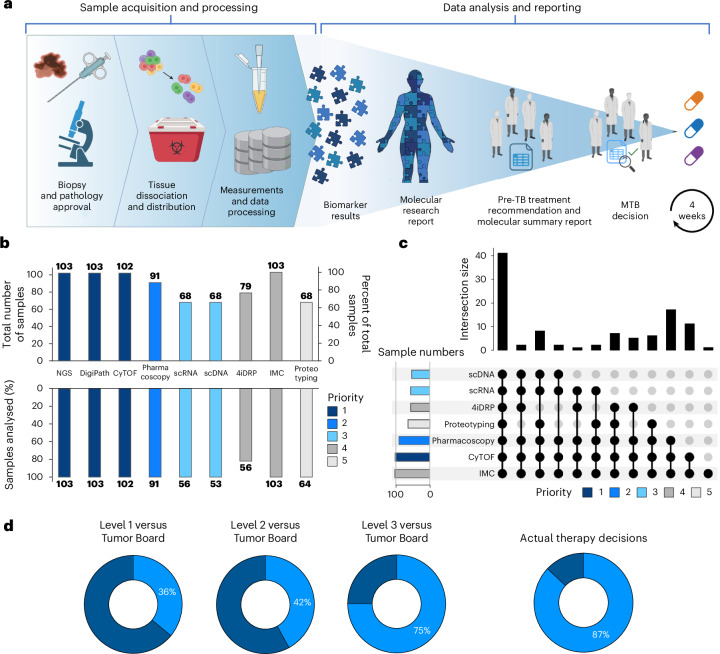
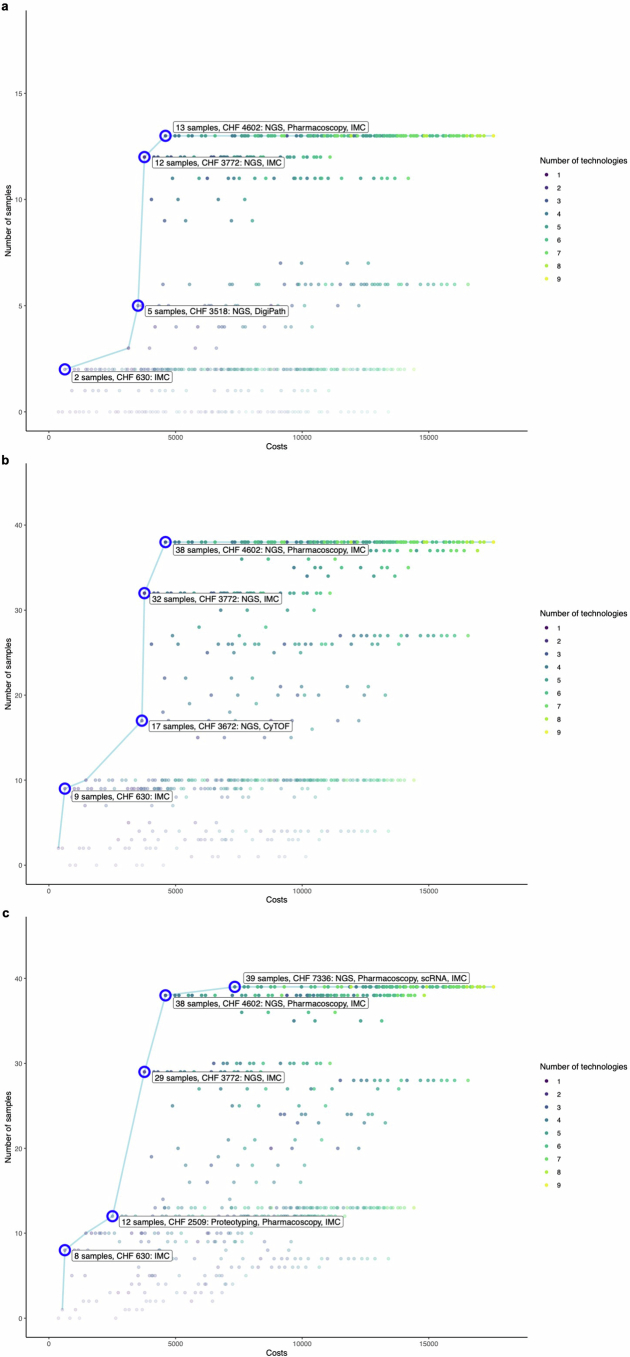
There is limited evidence supporting the feasibility of using omics and functional technologies to inform treatment decisions. Here we present results from a cohort of 116 melanoma patients in the prospective, multicentric observational Tumor Profiler (TuPro) precision oncology project. Nine independent technologies, mostly at single-cell level, were used to analyze 126 patient samples, generating up to 500 Gb of data per sample (40,000 potential markers) within 4 weeks. Among established and experimental markers, the molecular tumor board selected 54 to inform its treatment recommendations. In 75% of cases, TuPro-based data were judged to be useful in informing recommendations. Patients received either standard of care (SOC) treatments or highly individualized, polybiomarker-driven treatments (beyond SOC). The objective response rate in difficult-to-treat palliative, beyond SOC patients (n = 37) was 38%, with a disease control rate of 54%. Progression-free survival of patients with TuPro-informed therapy decisions was 6.04 months, (95% confidence interval, 3.75-12.06) and 5.35 months (95% confidence interval, 2.89-12.06) in ≥third therapy lines. The proof-of-concept TuPro project demonstrated the feasibility and relevance of omics-based tumor profiling to support data-guided clinical decision-making. ClinicalTrials.gov identifier: NCT06463509 .


Conflict of interest statement

Competing interests: B.B. is a founder and shareholder of Navignostics—a precision oncology spin-off from the University of Zurich—based on multiplexed imaging. V.H.K. reports being an invited speaker for Sharing Progress in Cancer Care (SPCC) and Indica Labs; advisory board of Takeda; sponsored research agreements with Roche and IAG, all unrelated to the current study. V.H.K. is a participant in patent applications on the assessment of cancer immunotherapy biomarkers by digital pathology and for the prediction of cancer recurrence risk and prediction of treatment efficacy using deep learning unrelated to the current study. G.G. is listed as inventor on patents related to the 4i technology (WO 2019/207004; WO 2020/008071, EP3922973B1). R.D. received funding from Novartis, Merck Sharp & Dohme (MSD), Bristol-Myers Squibb (BMS), Roche, Amgen, Takeda, Pierre Fabre, Sun Pharma, Sanofi, Catalym, Second Genome, Regeneron, T3 Pharma, MaxiVAX SA, Pfizer and Simcere. M.W. has received research grants from Novartis, Quercis and Versameb, and honoraria for lectures or advisory board participation or consulting from Anheart, Bayer, Curevac, Medac, Neurosense, Novartis, Novocure, Orbus, Pfizer, Philogen, Roche and Servier. A.W. and R.D. were part of the MTB that discussed the TuPro results. The other authors declare no competing interests.

Figures

Fig. 1
Fig. 1. Project overview.
a, Project description showing principal aspects for feasibility testing, patient populations included and information utilization. b, CONSORT flow diagram of the TuPro project. A total of 116 patients were included in the TuPro melanoma project. Part I included ten patients to establish the TuPro workflow and analysis/reporting pipeline. Part II included the remaining 106 patients in the diagnostic cohort. Thirteen patients either received BSC (n = 7) or did not receive adjuvant treatment based on shared decision-making (n = 6). The remaining 93 patients formed the TuPro application cohort, which was categorized into three groups: (1) adjuvant therapy, (2) SOC palliative therapy and (3) palliative therapy beyond SOC. In both palliative SOC and beyond SOC groups, more than one sample was evaluated for four patients. Two additional patients are both in the SOC and beyond SOC at different treatment lines. Illustrations in a created using BioRender.com.
Fig. 2
Fig. 2. TuPro workflow, technology node performance and output.
a, The TuPro workflow consists of a sample acquisition and processing phase, followed by an analysis and reporting phase, with a turnaround time of ≤4 weeks. The analysis phase involved nine technological nodes, although not all samples were analyzed by each node. Data processing integrated the outputs from different technologies and enabled the generation of the MSR, which encapsulates the essential findings and actionable insights for clinicians and researchers. b, Number of samples (n = 103) analyzed per technology node (n = 9) within the fast diagnostic loop (4-week turnaround time). Given limited sample material in some cases, the assays were prioritized as indicated by color. c, UpSet plot showing the number of samples analyzed by one or more technology nodes (n = 9). d, Concordance (percentage in light blue) between the recommendations agreed upon by the MTB and those inferred from information provided by diagnostic levels level 1 (detailed clinical data, routine molecular testing data in melanoma (BRAF, NRAS and c-KIT mutations) and DigiPath data), level 2 (level 1 plus large panel NGS), or level 3 (all TuPro technology nodes, n = 9), and fraction of actual TuPro-driven therapy decisions (i.e., ≥50% of the applied drugs are supported by markers measured by TuPro). Illustrations in a created using BioRender.com.
Fig. 3
Fig. 3. TuPro marker subset utilized in clinical decision-making.
a, OncoPrint showing biomarkers (cutoff of >2%) detected by TuPro and used for treatment decisions (n = 90). Data on the technology node used to measure each marker, the cohort and class of treatment received (chemotherapy, targeted therapy, immunotherapy) are provided. b, Markers (n = 26) used for treatment decision-making in the palliative SOC cohort. c, Markers (n = 44) used for treatment decision-making in the beyond SOC cohort.
Fig. 4
Fig. 4. Treatment and clinical outcome parameters for the TuPro application cohort.
ac, Treatments applied in the adjuvant (n = 13) (a), palliative SOC (n = 47) (b) and beyond SOC (n = 39) (c) groups. Outer circle, therapies received; inner circle, best responses per patient categorized as CR (dark green), PR (light green), SD (light blue), PD (red) or not evaluable. d, ORR, disease control rate and number of previous treatment lines before biopsy for patients in the palliative SOC and beyond SOC groups. Violin plots: solid lines, median; dotted lines, first (upper) and third (lower) quartiles. e,f, Alluvial plots showing the association between types of treatment received, line in which the treatment was received and disease control rate for the palliative SOC (e) and beyond SOC (f) groups. Brackets indicate at three or more treatment lines and disease control rate. g,h, Swimmers plots showing PFS and best response to treatment for palliative SOC (g) and beyond SOC (h) groups. Two patients serially received two different treatments; another two patients received serial samplings resulting in the same treatments.
Fig. 5
Fig. 5. Response rates and PFS of patients treated as per TuPro recommendations.
a, Best response (CR, PR, SD, PD) in patients under palliative treatments (SOC and beyond SOC) in the Tumor Profiler cohort (TuPro, n = 82, 4 not evaluable). b, Best response (CR, PR, SD, PD) in patients under palliative at least third line treatment in the TuPro cohort (n = 37). c, Median PFS in months in patients receiving palliative treatments (SOC and beyond SOC) in the TuPro cohort (n = 86). d, Median PFS in months in patients receiving palliative at least third line treatment in the TuPro cohort (n = 37).
Extended Data Fig. 1
Extended Data Fig. 1. Markers used for applied therapeutic decisions.
a, Markers (n = 54) used for treatment decision making in the adjuvant, SOC and beyond SOC cohorts. b, Markers (n = 12) used for treatment decision making in the adjuvant cohort. c, Individual measurements of markers for applied therapeutic decisions in the adjuvant setting. Markers (n = 12) and measurements (n = 50). d, Individual measurements of markers used for applied therapeutic decisions in the palliative SOC setting. Markers (n = 26) and measurements (n = 153). e, Individual measurements of markers used for applied therapeutic decisions in the beyond SOC setting. Markers (n = 44) and measurements (n = 196).
Extended Data Fig. 2
Extended Data Fig. 2. Cost analysis of technology nodes and node combinations used in the TuPro project per cohort.
a, adjuvant, b, palliative SOC cohort, c, palliative beyond SOC. The x-axis shows the marginal costs in Swiss francs (CHF) of production, representing the cost of one additional analysis using a combination of technology nodes running at full capacity. The y-axis shows the number of patients that would have all relevant information available with the corresponding subset of technologies when compared to using all technologies. The labels on each data node indicate the individual technology nodes and combined cost per sample. Each dot corresponds to a different combination of technologies associated with a total cost for that combination. Only the best combinations are shown, as other combinations have a higher cost or a smaller number of samples with available relevant information. This analysis provides a better understanding of the cost-effectiveness of various diagnostic approaches and the trade-offs between the generated information and associated expenses.
Extended Data Fig. 3
Extended Data Fig. 3. Alluvial plot for clinical implications of serial biopsies.
First column (Patient) shows patients with serial biopsies (n = 8, two biopsies per patient). Second (Sample ID) and third (Treatment) column showing both biopsy samples per patient. Orange: serial biopsies leading to different treatment recommendations, light green: serial biopsies not changing treatment decision. Forth column (cohort) showing serial and biopsy decisions leading to change of classification based on clinical criteria (dark red, either palliative SOC or beyond SOC) or no change in cohort classification (dark green).
Extended Data Fig. 4
Extended Data Fig. 4. Adjusted relapse-free survival of adjuvant patients treated as per TuPro recommendation versus non-TuPro subjects.
a, Kaplan-Meier curve and adjusted relapse-free survival (RFS) in months, crude hazard ratio, adjusted hazard ratio and Log-rank P-value for the comparison between unmatched adjuvant treatments. b, Kaplan-Meier curve and adjusted RFS in months, crude hazard ratio, adjusted hazard ratio and Log-rank P-value for the comparison between matched adjuvant treatments.
Extended Data Fig. 5
Extended Data Fig. 5. Response rates and adjusted PFS of patients treated in the palliative SOC or beyond SOC cohort as per TuPro recommendations versus non-TuPro subjects.
a, Best response (complete response (CR), partial response (PR), stable disease (SD), progressive disease (PD)) in unselected, palliative treatments (SOC and beyond SOC) in the Tumor Profiler cohort (TuPro, n = 86) and the non-TuPro cohort (n = 132, 3 not evaluable). Combined disease control rate in the TuPro cohort of 61.0% (50/82, 4 not evaluable) vs. 57.6% (76/132, 3 not evaluable) in non-TuPro patients. Adjusted odds ratio of 1.54 (95% confidence interval (CI), 0.75 – 3.16). b, Best response (CR, PR, SD, PD) in unselected, palliative ≥ 3rd treatment line in the TuPro cohort (n = 37) and the non-TuPro cohort (n = 26). Combined disease control rate in the TuPro cohort of 56.8% (21/37) vs. 38.5% (10/26) in non-TuPro patients. Adjusted odds ratio of 3.67 (95% CI, 0.79 – 17). c, Best response of matched TuPro (n = 59) and non-TuPro (n = 59) palliative treatments (SOC and beyond SOC). Combined disease control rate in the TuPro cohort of 63.6% (35/55, 4 not evaluable) compared to 51.7% (30/58, 1 not evaluable), respectively. Adjusted odds ratio of 1.74 (95% CI, 0.68 – 4.45). d, Best response of matched TuPro (n = 17) and non-TuPro (n = 17) palliative ≥ 3rd treatment line. Combined disease control rate in the TuPro cohort of 64.7% (11/17) vs. 23.5% (4/17), respectively. Adjusted odds ratio of 7.18 (95% CI, 0.60 – 85.61). e, f, Kaplan-Meier curves and adjusted Progression free survival (PFS) in months, crude hazard ratio, adjusted hazard ratio and Log-rank P-value for the comparison between unmatched treatments: e, palliative (SOC and beyond SOC) TuPro cohort (n = 86 treatment lines) and non-TuPro cohort (n = 135 treatment lines): 6.04 months, (95% CI, 3.75 – 12.06) TuPro cohort vs. 5.62 months (n = 135, 95% CI, 3.09 – 9.46) in the non-TuPro cohort (crude hazard ratio (HR) of 0.93 (95% CI, 0.68 – 1.28), P = 0.5967, adjusted HR 0.89 (95% CI, 0.57 – 1.37). f, patients receiving ≥ 3rd treatment line in the TuPro cohort (n = 37) and non-TuPro cohort (n = 26): 5.35 months (95% CI, 2.89 – 12.06) vs. 2.56 months (n = 26, 95% CI, 2.00 – 5.62) (crude HR 0.52 (95% CI, 0.30 – 0.88), P = .0602, adjusted HR 0.39 (95% CI, 0.15 – 1.05), respectively. g, h, Kaplan-Meier curves and adjusted PFS in months, crude hazard ratio, adjusted hazard ratio and Log-rank P-value for the comparison between matched treatments: g, matched palliative (SOC and beyond SOC) TuPro cohort (n = 59 treatment lines) and non-TuPro cohort (n = 59 treatment lines): 9.59 months (95% CI, 3.75 – 17.74) vs. 3.55 months (95% CI, 2.56 – 9.17), respectively (adjusted HR of 0.78 (95% CI, 0.43 – 1.42), P = .4156. h, matched patients receiving ≥ 3 treatment line in the TuPro cohort (n = 17) and non-TuPro cohort (n = 17): 8.34 months (95% CI, 2.76 – NR) vs. 2.0 months (95% CI, 1.08 – 3.06), respectively (adjusted HR of 0.23 (95% CI, 0.07 – 0.79), P = .0201. CI, 95% confidence interval; HR, hazard ratio.

References

    1. Michielin, O., Van Akkooi, A. C. J., Ascierto, P. A., Dummer, R. & Keilholz, U. Cutaneous melanoma: ESMO Clinical Practice Guidelines for diagnosis, treatment and follow-up. Ann. Oncol.30, 1884–1901 (2019). - PubMed
    1. Coit, D. G. et al. Cutaneous melanoma, version 2.2019, NCCN clinical practice guidelines in oncology. J. Natl Compr. Cancer Netw.17, 367–402 (2019). - PubMed
    1. Rocque, G. B. et al. Concordance with NCCN treatment guidelines: relations with health care utilization, cost, and mortality in breast cancer patients with secondary metastasis. Cancer124, 4231–4240 (2018). - PubMed
    1. Andreano, A., Rebora, P., Valsecchi, M. G. & Russo, A. G. Adherence to guidelines and breast cancer patients survival: a population-based cohort study analyzed with a causal inference approach. Breast Cancer Res Treat.164, 119–131 (2017). - PubMed
    1. Woolf, S. H., Grol, R., Hutchinson, A., Eccles, M. & Grimshaw, J. Clinical guidelines: potential benefits, limitations, and harms of clinical guidelines. Br. Med. J.318, 527–530 (1999). - PMC - PubMed

Publication types

Substances

Associated data