. 2025 May 27;22(1):143.
doi: 10.1186/s12974-025-03465-9.

Semaglultide targets Spp1+ microglia/macrophage to attenuate neuroinflammation following perioperative stroke

Affiliations

Semaglultide targets Spp1+ microglia/macrophage to attenuate neuroinflammation following perioperative stroke

Yan Li et al. J Neuroinflammation. .

Abstract

Peripheral surgery evokes neuroimmune activation in the central nervous system and modulates immune cell polarization in the ischemic brain. However, the phenotypic change of microglia and myeloid cells within post-surgical ischemic brain tissue remain poorly defined. Using an integrated approach that combines single-cell RNA sequencing with comprehensive biological analysis in a perioperative ischemic stroke (PIS) model, we identified a distinct Spp1-positive macrophage/microglia (Spp1+ Mac/MG) subgroup that exhibit enriched anti-inflammatory pathways with distinct lipid metabolic reprogrammed profile. Moreover, using immunofluorescence staining, we identified the expression of Glucagon-like peptide-1 receptor (GLP1R) in Spp1+F4/80+ cells and Spp1+Iba-1+ cells. Intraperitoneal administration of semaglutide, a GLP1R agonist clinically approved for the treatment of type 2 diabetes mellitus, resulted in a significant reduction of cerebral infarct volume in PIS mice compared to that in ischemic stroke (IS) mice. Meanwhile, semaglutide treatment also increased the proportion of Spp1+Edu+Iba-1+ cells 3 days after PIS. Using high-parameter flow cytometry, immunofluorescence staining and RNA sequencing, we demonstrated that semaglutide treatment significantly attenuated the expression of neuroinflammatory markers in mice following PIS. We also found that semaglutide treatment significantly ameliorated sensorimotor dysfunction up to 3 days after PIS in mice. Our current finding reveal a novel protective Spp1+Mac/MG subset after PIS and demonstrated that it can be upregulated by semaglutide. We propose that targeting Spp1+Mac/MG subsets using semaglutide could serve as a promising strategy to attenuate the exacerbated neuroinflammation in PIS.

Keywords: Neuroinflammation; Perioperative ischemic stroke; Semaglutide; Spp1+ Mac/MG.


Conflict of interest statement

Declarations. Ethical approval: Not applicable. Consent for publication: Not applicable. Competing interests: The authors declare no competing interests.

Figures
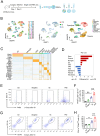
Fig. 1
Fig. 1
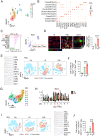
Surgery induces pronounced F4/80+Ly6GCD11b+CD45+ cells and CD11b+CD45int cells change in the ischemic brain. A. Diagram of experimental design. All cells were sequenced with a modified 10X chromium scRNA-seq procedure. B. UMAP representation of the 40,986 single cells shows the cellular heterogeneity of brain cells. Dots, individual cells; colors, cell clusters (left). UMAP representation of cells from 2 Ctr (n=14696 cells), 2 IS (n=12251 cells) and 2 PIS (n=14039 cells) mice brain. Dots, individual cells; colors, different origin (middle). UMAP representation of the 40,986 single cells shows the different cell types of brain cells. Dots, individual cells; colors, cell types (right). C. The heatmap of different expressed genes in different subclusters of cells in the above ischemic brain. D. Bi-directional histograms depict differences in relative cluster abundance between PIS and IS samples as shown in C. E. Flow cytometry analysis of F4/80+Ly6GCD11b+CD45+ cells in the brain of Control (Ctr), Surgery, IS and PIS mice 3 d after dMCAO. F. Frequencies of F4/80+Ly6GCD11b+CD45+ cells of tissue-resident leukocytes isolated out of the brain in E (n = 3–4 per group, one-way ANOVA with Bonferroni multiple comparisons test). G. Flow cytometry analysis of CD11b+CD45int cells in the brain of Ctr, Surgery, IS and PIS mice 3 d after dMCAO. H. Frequencies of CD11b+CD45int cells of tissue-resident leukocytes isolated out of the brain in E (n = 4 per group, one-way ANOVA with Bonferroni multiple comparisons test). Data are represented as mean ± SD. * p ≤ 0.05, ** p ≤ 0.01
Fig. 2
Fig. 2
Spp1+ macrophages (Mac)/Microglia (MG) subsets emerged in PIS mouse brain. A. Uniform manifold approximation and projection (UMAP) representation of leukocytes in brain from Control (Ctr), IS, PIS mice 3 days after dMCAO for scRNA-seq colored by cell type (left) or sample (right). Each dot corresponds to one single cell. B. Dot plot of selected marker genes characterizing the clusters shown in A. The color of the dot indicates an average expression. C. Bi-directional histograms depict differences in relative cluster abundance between PIS and IS samples as shown in A (left). Feature Plots of selected marker genes (Spp1) specifically enriched in the Mac1 cluster (right). D. Representative images and statistical analysis of Spp1+F4/80+ cells of brain sections from Ctr, IS and PIS mice, as indicated 3 days after dMCAO. Scale bar: 20 μm. Zoom: Scale bar: 5 μm. Quantification of the percentage of Spp1+Mac in the brain of each group (n = 4 per group, one-way ANOVA with Bonferroni multiple comparisons test). E. t-distributed stochastic neighboring embedding (t-SNE) plots of high-parameter flow cytometry data of leukocytes extracted from brain of Ctr, IS and PIS mice at 3 days after dMCAO. Color coded by the epitope markers for F4/80+macrophages (red), CD3+ T cells (CD4+ T cells and CD8+ T cells), B220+ B cells, CD11c+ DCs, Ly6G+ neutrophils and by Spp1 expression (orange) in leukocytes. (n = 4 per group, one-way ANOVA with Bonferroni multiple comparisons test) (left). F. Comparison of Ctr, IS and PIS conditions reveals the high amounts of Spp1+F4/80+CD11b+CD45+ cells in brain from PIS compared with IS mice. (n = 4 per group, one-way ANOVA with Bonferroni multiple comparisons test) (right). G. UMAP representation of microglia from brain tissues of Ctr, IS and PIS mice 3 days after dMCAO. Each dot corresponds to one single cell. H. Violin plot of Spp1 in all microglia clusters of IS and PIS mice. I. t-SNE plots of high-parameter flow cytometry data of leukocytes extracted from brain of Ctr, IS and PIS mice at 3 days after dMCAO. Color coded by the epitope markers for CX3CR1+ microglia (red), CD3+ T cells (CD4+ T cells and CD8+ T cells), B220+ B cells, CD11c+ DCs, Ly6G+ neutrophils and by Spp1 expression (orange) in leukocytes. J. The absolute numbers of Spp1+CX3CR1+CD11b+CD45+ cells in brain as indicated groups. (n = 4 per group, one-way ANOVA with Bonferroni multiple comparisons test). Data are represented as mean ± SD. *** p ≤ 0.001, **** p ≤ 0.0001
Fig. 3
Fig. 3
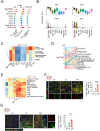
Spp1+Mac/MG subsets with similar characteristics in terms of inflammation, phagocytosis and lipid metabolic program. A. Gene set variation analysis (GSVA) of M1 vs. M2 down, Phagocytosis, Lipid metabolic process genes for each leukocyte. B. Violin plot of Ctsb, Ctsd, Cd36 and Arg1 in all leukocyte clusters. C. Heatmap showing the GSVA score of trem2high macrophage, Age-associated macrophage and the stroke-associated myeloid cell (SAMC) for each cluster defined as the average normalized expression of the pathway-related genes. See Additional file 1: Table 1 (a list of previously defined population genes under different pathological and physiological conditions) for a list of trem2high macrophage, Age-associated macrophage and the stroke-associated myeloid cell (SAMC) associated genes. D. Alluvial plot depicting the most affected KEGG for each cluster. Upregulated genes of each cluster were used for the enrichment analysis. Ribbon thickness indicates the number of genes per biological term. E. Heatmap showing the GSVA score of Jordao_microglia, BODIPYhi vs. BODIPYlow, IRM injury-responsive microglia (IRM), Keren-shaul_DAM, MgnD_signature, disease-associated microglia (DAM), axon tract associated microglia (ATM), DAM1, DAM2, Age-associated microglia for each cluster defined as the average normalize expression of the pathway-related genes. See Additional file 1: Table 1 (a list of previously defined population genes under different pathological and physiological conditions) for a list of associated genes. F. Representative confocal images of Arg1, Spp1 and Iba-1 triple immunostaining in the ischemic penumbra in Ctr, IS and PIS mice at 3days after dMCAO. Scale bar: 40 μm. Quantification of the percentage of Arg1+Spp1+Iba-1+ cells in the brain of each group. (n = 4 per group, one-way ANOVA with Bonferroni multiple comparisons test). G. Representative confocal images of CD36, Spp1 and Iba-1 triple immunostaining in the ischemic penumbra in Ctr, IS and PIS mice at 3days after dMCAO. Scale bar: 40 μm. Quantification of the percentage of CD36+Spp1+ Iba-1+ cells in the brain of each group. (n = 4 per group, one-way ANOVA with Bonferroni multiple comparisons test). The data are shown as means ± SD. ***p ≤ 0.001, **** p ≤ 0.0001
Fig. 4
Fig. 4
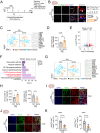
Proliferative Mki67+MG can differentiate into Spp1+MG in PIS. A. Bi-directional histograms depict differences in microglia clusters abundance between PIS and IS samples as shown in Fig. 3B. UMAP displays cell cycle scores determined by expression of highly conserved cell cycle genes. C. Violin plot of Mki67, Top2a in all microglia clusters of IS and PIS mice. D. Representative confocal images of Mki67 and Iba-1 double immunostaining in the ischemic penumbra and quantification of the percentage of Mki67+/ Iba-1+ cells in IS and PIS mice at 3 days after tMCAO. Scale bar: 20 μm. (n = 4 per group, unpaired Student’s t test). E. Projection of pseudo-time generated with Monocle version 3 to infer the potential lineage differentiation trajectory onto the combined UMAP. From dark blue to yellow, indicating early and terminal states in the ischemic brain at different times after MCAO, respectively. F. Expression of selected genes (Mki67, Top2a, Birc5, Spp1) along pseudotime for microglia differentiation. G. Representative confocal images of Spp1, Iba-1 and EdU triple immunostaining in the ischemic penumbra in Ctr, IS and PIS mice at 3days after dMCAO. Scale bar: 20 μm. Zoom in: Scale bar: 5 μm. Quantification of the percentage of Spp1+ Edu+ Iba-1+ cells in the brain of each group. (n = 4 per group, one-way ANOVA with Bonferroni multiple comparisons test). Data are represented as mean ± SD. *** p ≤ 0.001, **** p ≤ 0.0001
Fig. 5
Fig. 5
The expression of GLP1R in Spp1+ Mac/MG subpopulations increased in PIS mice. A. Representative confocal images of GLP1R+ Spp1+ F4/80+ cells in ischemic penumbra in brain sections of indicated groups. Scale bar: 50 μm. B. Representative confocal images of GLP1R+ Spp1+ Iba-1+ cells in ischemic penumbra in brain sections of indicated groups. Scale bar: 50 μm. C. Quantification of the percentage of GLP1R+ Spp1+ F4/80+ cells (left) and GLP1R+ Spp1+ Iba-1+ cells (right) in the brain of each group in A and B. (n = 5 per group, one-way ANOVA with Bonferroni multiple comparisons test). D. Gating strategy to identify CD45+CD11b+ cells by flow cytometry. E. Flow cytometry analysis of GLP1R+Spp1+CD45+CD11b+ cells isolated out of the brain from Ctr, IS and PIS mice 3 days after dMCAO. F. Frequencies of GLP1R+Spp1+ cells of CD45+CD11b+ cells isolated out of the brain from Ctr, IS and PIS mice 3 days after dMCAO analyzed by Flow cytometry. (n = 5–7 per group, one-way ANOVA with Bonferroni multiple comparisons test). The data are shown as means ± SD. ***p ≤ 0.001, **** p ≤ 0.0001
Fig. 6
Fig. 6
Semaglutide increase the number of protective Spp1+Mac/MG subpopulations and attenuate the neuroinflammation in PIS. A. The scheme of mice was administered PBS (Veh), semaglutide (Sema) after dMCAO in PIS mice. B. Representative confocal images (Left) and quantification (Right) of percentage of Spp1+EdU+ Iba-1+ cells in ischemic penumbra in brain sections of indicated groups. Triangles indicate resident Spp1+ Edu+ Iba-1+ cells. (n = 4 per group, unpaired Student’s t test). C. t-SNE plots of high-parameter flow cytometry data of leukocytes extracted from brain of mice administered Veh, Sema 3 days after dMCAO in PIS mice. Color coded by the epitope markers for CX3CR1+ microglia and F4/80+ macrophage (red), CD3+T cells (CD4+T cells and CD8+T cells), B220+B cells, CD11c+ DCs, Ly6G+neutrophils and by Spp1 expression (orange) in leukocytes. D. The absolute numbers of Spp1+ Mac/MG in brain as indicated groups in C. (n = 4 per group, unpaired Student’s t test). E. Volcano plot showed the upregulated (red) and downregulated (blue) genes from RNA sequencing of CD11b+ cells from of mice administered Veh, Sema 3 days after dMCAO in PIS mice. The horizontal axis is log2fold change, and the vertical axis is -log10p value, p < 0.05. F. KEGG enrichment top 7 analysis suggested that PPAR signaling pathway and cytokine-cytokine receptor interaction were related with inflammation and the phenotypic changes of macrophage or microglia. G. t-SNE plots of high-parameter flow cytometry data of leukocytes extracted from brain of mice administered Veh, semaglutide (Sema) 3 days after dMCAO in PIS mice. Color coded by the epitope markers for CX3CR1+microglia and F4/80+macrophage (orange), CD3+ T cells (CD4+ T cells and CD8+ T cells), B220+ B cells, CD11c+ DCs, Ly6G+ neutrophils and Arg1 (light green) and CD16 (dark green) expression in leukocytes. H. The absolute numbers of Arg1+ Mac/MG (left) and CD16+ Mac/MG (right) in brain as indicated groups in G. (n = 4 per group, unpaired Student’s t test). I. Representative confocal images of the iNOS and F4/80 in ischemic penumbra in brain sections of indicated groups in male mice. Scale bar, 50 μm. J. Representative confocal images of the iNOS and Iba-1 in ischemic penumbra in brain sections of indicated groups in male mice. Scale bar, 50 μm. K. Quantification of percentage of iNOS+F4/80+ cells (left) and iNOS+Iba-1+ cells (right) in brain sections of indicated groups in I-J. (n = 9 per group in male, n = 8–9 per group in female, unpaired Student’s t test). The data are shown as means ± SD. *p ≤ 0.05, ***p ≤ 0.001, **** p ≤ 0.0001
Fig. 7
Fig. 7
Semaglutide reduces brain infarct injury and attenuates neurological dysfunction in PIS mice. A. Representative MAP2 staining (red) of brain infarct and endogenous mouse IgG staining (green) of BBB leakage of indicated groups in male (left) and female (right) mice. B. Quantification of infarct volume and IgG leakage of indicated groups in male (left) and female (right) mice. (n = 4–5 per group, unpaired Student’s t test). C. Representative confocal images of the tight junction protein Claudin-5 and CD31 in brain sections of indicated groups in mice. Scale bar, 100 μm. Zoom in: Scale bar, 100 μm. D. Representative confocal images of the VE-cadherin and CD31 in brain sections of indicated groups in mice. Scale bar, 100 μm. Zoom in: Scale bar, 100 μm. E. Representative confocal images of the tight junction protein ZO-1 and CD31 in brain sections of indicated groups in male mice. Scale bar, 100 μm. Zoom in: Scale bar, 100 μm. F. Representative confocal images of the tight junction protein ZO-1 and CD31 in brain sections of indicated groups in female mice. Scale bar, 100 μm. Zoom in: Scale bar, 100 μm. G. Quantification of Claudin-5 mean fluorescence intensity (MFI) of indicated groups in C. (n = 4 per group, unpaired Student’s t test). Quantification of VE-cadherin MFI of indicated groups in D. (n = 4 per group, unpaired Student’s t test). Quantification of ZO-1 MFI of indicated groups in E. (n = 11 per group in male, unpaired Student’s t test). Quantification of ZO-1 MFI of indicated groups in F. (n = 14–18 per group in female, unpaired Student’s t test). H. Sensorimotor dysfunction after PIS in vehicle-treated and semaglutide-treated mice assessed by grip strength test (male: left; female: right). (n = 10 per group. two-way ANOVA with Bonferroni multiple comparisons test. The data are shown as means ± SD. *p < 0.05, **p < 0.01, ***p ≤ 0.001, **** p ≤ 0.0001

Similar articles

Cited by

References

    1. Gelderblom M, et al. Temporal and Spatial dynamics of cerebral immune cell accumulation in stroke. Stroke. 2009;40(5):1849–57. - PubMed
    1. Zhou L, et al. Treatment of cerebral ischemia by disrupting ischemia-induced interaction of nNOS with PSD-95. Nat Med. 2010;16(12):1439–43. - PubMed
    1. Collaborators GBDN. Global, regional, and National burden of neurological disorders, 1990–2016: a systematic analysis for the global burden of disease study 2016. Lancet Neurol. 2019;18(5):459–80. - PMC - PubMed
    1. Hao H, et al. Inhibition of Bruton’s tyrosine kinase restricts neuroinflammation following intracerebral hemorrhage. Theranostics. 2025;15(2):494–508. - PMC - PubMed
    1. Pocock JM, Piers TM. Modelling microglial function with induced pluripotent stem cells: an update. Nat Rev Neurosci. 2018;19(8):445–52. - PubMed