. 2025 May 21;15(5):534.
doi: 10.3390/brainsci15050534.

Chronic Stress Modulates Microglial Activation Dynamics, Shaping Priming Responses to Subsequent Stress

Affiliations

Chronic Stress Modulates Microglial Activation Dynamics, Shaping Priming Responses to Subsequent Stress

Junyu Chen et al. Brain Sci. .

Abstract

(1) Background: The high recurrence rate and individual differences in stress susceptibility contribute to the diverse symptoms of depression, making full recovery and relapse prevention challenging. Emerging evidence suggests that fluctuations in microglial activity are closely linked to depression progression under chronic stress exposure. Changes in the brain microenvironment can elicit microglial priming, enhancing their sensitivity to external stimuli. However, few studies have longitudinally examined how microglial characteristics evolve throughout depression progression. (2) Methods: In this study, we investigated microglial morphological changes and their responses to acute stress at different stages of depression using the chronic unpredictable mild stress (CUMS) paradigm in mice. (3) Results: Our findings reveal that in the dentate gyrus, microglial activation indices, including cell number and morphology, exhibit distinct dynamic patterns depending on CUMS exposure duration. Notably, after 2 and 4 weeks of CUMS exposure followed by acute stress re-exposure, microglia display opposing response patterns. In contrast, after 6 weeks of CUMS exposure, primed microglia exhibit dysfunction, failing to respond to acute stress. Notably, depressive behaviors are not prominent after 2 weeks of CUMS exposure but become more pronounced after 4 and 6 weeks of exposure. Additionally, regardless of CUMS duration, body weight demonstrates an intrinsic capacity to normalize after stress cessation. (4) Conclusions: These findings suggest that microglial priming responses are state-dependent, either enhancing or suppressing secondary stimulus responses, or exceeding physiological limits, thereby preventing further activation. This study provides novel insights into the role of microglial priming in stress vulnerability and its contribution to depression progression.

Keywords: chronic unpredictable mild stress (CUMS); depression; microglia; microglial priming; stress vulnerability.


Conflict of interest statement

The authors declare that they have no conflicts of interest.

Figures
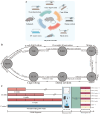
Figure 1
Figure 1
CUMS paradigm and weekly exposure schedule. (A) An illustration of the 11 stressors used in the CUMS paradigm, Table 2. The CUMS frequencies per week are indicated. (B) These stressors were randomly administered to the CUMS group mice each week based on the exposure schedule. The outer part of the exposure schedule represents prolonged stressors, such as flash exposure (24 h), whereas the inner section represents short-term stressors, such as tail pinching (2 min). (C) A schematic timeline of the experimental procedures.
Figure 2
Figure 2
CUMS exposure induced a remarkable reduction in the body weight of mice. (A) The body weights of all mice were measured on the first day (day 0, red arrow) of commencing the CUMS exposure procedure. Subsequently, body weight was measured every Sunday (green arrow) each week. (B) All CUMS group mice showed a significant decrease in body weight compared to their respective control group mice (Table S1A). (C) The body weight gain of all CUMS group mice was suppressed and significantly lower than that of the respective control group (Table S1B). Statistical analysis was performed using two-way ANOVA, followed by Bonferroni’s post-hoc test. Data are presented as the mean ± SEM, n = 6 for each group. * p < 0.05, ** p < 0.01, *** p < 0.001.
Figure 3
Figure 3
The body weight of the mice rapidly recovered after the cessation of CUMS exposure. (A) The body weight of all mice was measured on Sunday of the final week and regarded as day 0 upon exposure to CUMS (day 0, red arrow). After the behavioral test, the body weight of all mice was measured on the final day of the test and on the final day of the recovery period, which were regarded as recovery day 1 (R1, red arrow) and recovery day 5 (R5, red arrow), respectively. (B) The body weight of the CUMS group mice sharply increased to match the control group level after 2 and 4 weeks of CUMS exposure, whereas a significant difference was observed after 6 weeks of CUMS exposure compared to the respective control group, as assessed by two-way ANOVA followed by Bonferroni’s post-hoc test (Table S1C, n = 6 for each group). (C) The body weight gain of all CUMS group mice was significantly higher than that of the control group mice, as assessed by two-way ANOVA followed by Bonferroni’s post-hoc test (Table S1D, n = 6 for each group). (D) No significant difference in body weight gain among all CUMS group mice during the behavioral test and recovery periods was observed, as assessed by one-way ANOVA followed by Tukey’s post-hoc test (F(2,15) = 2.057, p = 0.16 during the behavioral test period; F(2,15) = 2.231, p = 0.14 during the recovery period, n = 6 for each group). (E) The body weight gain during the behavioral test was significantly higher than during the recovery period in all CUMS groups, as assessed by Student’s two-tailed paired t-test (t(34) = 3.747, p < 0.001, total CUMS group mice (n = 18)). (F) No correlation was found between body weight gain during the behavioral test and the recovery period in all CUMS group mice, as assessed by simple linear regression (R2 = 0.092, p = 0.222, total CUMS group (n = 18)). Data are presented as the mean ± SEM, * p < 0.05, ** p < 0.01, *** p < 0.001.
Figure 4
Figure 4
CUMS exposure induced depression-like behavior, which depended on the duration of exposure. (A) No differences were observed when comparing traces of all CUMS group mice with control group mice. (B) No significant difference was found between all CUMS group mice and their respective control group mice in either the total distances traveled or the ratio of time spent in the center region (Table S1E,F). (C) The immobility time in the TST was significantly increased in the 6-week CUMS group mice compared to their respective control group mice (Table S1G). (D) The immobility time in the FST was significantly increased in the 4- and 6-week CUMS groups compared to their respective control groups (Table S1H). Statistical analysis was performed using two-way ANOVA, followed by Bonferroni’s post-hoc test. Data are presented as the mean ± SEM, n = 6 for each group. ** p < 0.01.
Figure 5
Figure 5
Different durations of CUMS exposure and subsequent acute stress re-exposure led to dynamic variations in microglial density in the hippocampus. (A) DAB staining of Iba-1 images showed changes in microglial density in the DG of the hippocampus in the control group mice and mice after different durations of CUMS exposure (top panel). Additionally, changes in microglial density after CUMS exposure followed by acute stress (re-)exposure are shown in the bottom panel. Images show only the left side of the DG, n = 3 for each group; scale bar = 50 µm. (B) Microglial density showed different fluctuation patterns after different durations of CUMS exposure (Table S1I). (C) No significant difference in microglial density was observed between the control group mice exposed to acute stress and those not exposed (Table S1J). (D) After CUMS exposure followed by acute stress re-exposure, the microglial density exhibited a converse fluctuation pattern compared to the respective CUMS group mice not exposed to acute stress (Table S1K). Statistical analysis was performed using two-way ANOVA, followed by Bonferroni’s post-hoc test. Data are presented as the mean ± SEM. Each sample was obtained from at least 18 images (n = 3 for each group); * p < 0.05, *** p < 0.001.
Figure 6
Figure 6
The microglial density showed a significant increase after 4 weeks of CUMS exposure in the mPFC, and no significant difference was observed after CUMS exposure followed by acute stress re-exposure. (A) DAB staining of Iba-1 images showed changes in microglial density in the mPFC of the control group mice and mice after different durations of CUMS exposure (top panel). Additionally, changes in microglial density after CUMS exposure followed by acute stress (re) exposure are shown in the bottom panel. Scale bar = 100 µm. (B) A significant increase in microglial density was observed after 4 weeks of CUMS exposure compared to the respective control group mice (Table S1L). (C) No significant difference in microglial density was observed between the control group mice exposed to acute stress and those not exposed (Table S1M). (D) No significant difference was observed after CUMS exposure followed by acute stress re-exposure compared to the respective CUMS group mice without re-exposure (Table S1N). Statistical analysis was performed using two-way ANOVA, followed by Bonferroni’s post-hoc test. Data are presented as the mean ± SEM. Each sample was obtained from at least 18 images (n = 3 for each group); * p < 0.05.
Figure 7
Figure 7
The morphological diversity of microglia was observed after CUMS exposure, followed by acute stress re-exposure. (A) IF staining of Iba-1 images showed changes in microglial morphology in the DG of the hippocampus in the control group mice and mice after different durations of CUMS exposure (−). Additionally, changes in microglial morphology after CUMS exposure followed by acute stress (re-)exposure are shown in (+). The images show only the left side of the DG (scale bar = 20 µm). (B) The branch number of microglia showed different fluctuation patterns after different durations of CUMS exposure, while no significant difference was observed after 6 weeks of CUMS exposure (Table S1O, n = 3 for each group). (C) No significant difference in the branch number of microglia was observed between the control group mice exposed to acute stress and those not exposed (Table S1P, n = 3 for each group). (D) After CUMS exposure followed by acute stress re-exposure, the branch number of microglia showed a converse fluctuation pattern compared to those not exposed to acute stress in respective CUMS group mice, while no significant difference was observed after 6 weeks of CUMS exposure followed by acute stress re-exposure (Table S1Q). Statistical analysis was performed using two-way ANOVA followed by Bonferroni’s post-hoc test. Data are presented as the mean ± SEM. Each sample was obtained from at least 18 images; * p < 0.05, ** p < 0.01.

Similar articles

References

    1. Malhi G.S., Mann J.J. Depression. Lancet. 2018;392:2299–2312. doi: 10.1016/S0140-6736(18)31948-2. - DOI - PubMed
    1. Szepesi Z., Manouchehrian O., Bachiller S., Deierborg T. Bidirectional Microglia–Neuron Communication in Health and Disease. Front. Cell. Neurosci. 2018;12:323. doi: 10.3389/fncel.2018.00323. - DOI - PMC - PubMed
    1. Wright-Jin E.C., Gutmann D.H. Microglia as Dynamic Cellular Mediators of Brain Function. Trends Mol. Med. 2019;25:967–979. doi: 10.1016/j.molmed.2019.08.013. - DOI - PMC - PubMed
    1. Ransohoff R.M., Perry V.H. Microglial Physiology: Unique Stimuli, Specialized Responses. Annu. Rev. Immunol. 2009;27:119–145. doi: 10.1146/annurev.immunol.021908.132528. - DOI - PubMed
    1. Tynan R.J., Naicker S., Hinwood M., Nalivaiko E., Buller K.M., Pow D.V., Day T.A., Walker F.R. Chronic Stress Alters the Density and Morphology of Microglia in a Subset of Stress-Responsive Brain Regions. Brain Behav. Immun. 2010;24:1058–1068. doi: 10.1016/j.bbi.2010.02.001. - DOI - PubMed

LinkOut - more resources