

Identification of Therapeutic Targets for Hyperuricemia: Systematic Genome-Wide Mendelian Randomization and Colocalization Analysis
- PMID: 40426853
- PMCID: PMC12109542
- DOI: 10.3390/biomedicines13051022
Identification of Therapeutic Targets for Hyperuricemia: Systematic Genome-Wide Mendelian Randomization and Colocalization Analysis
Abstract
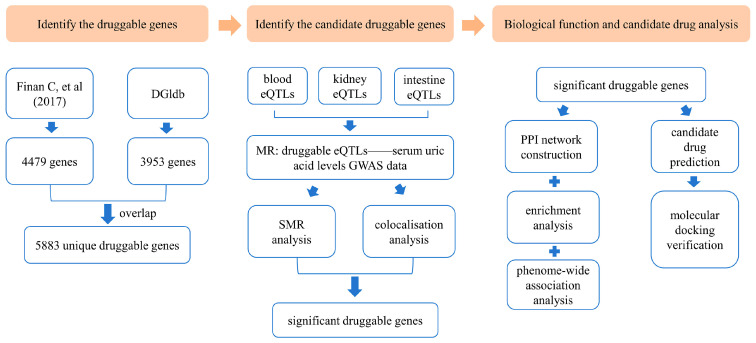
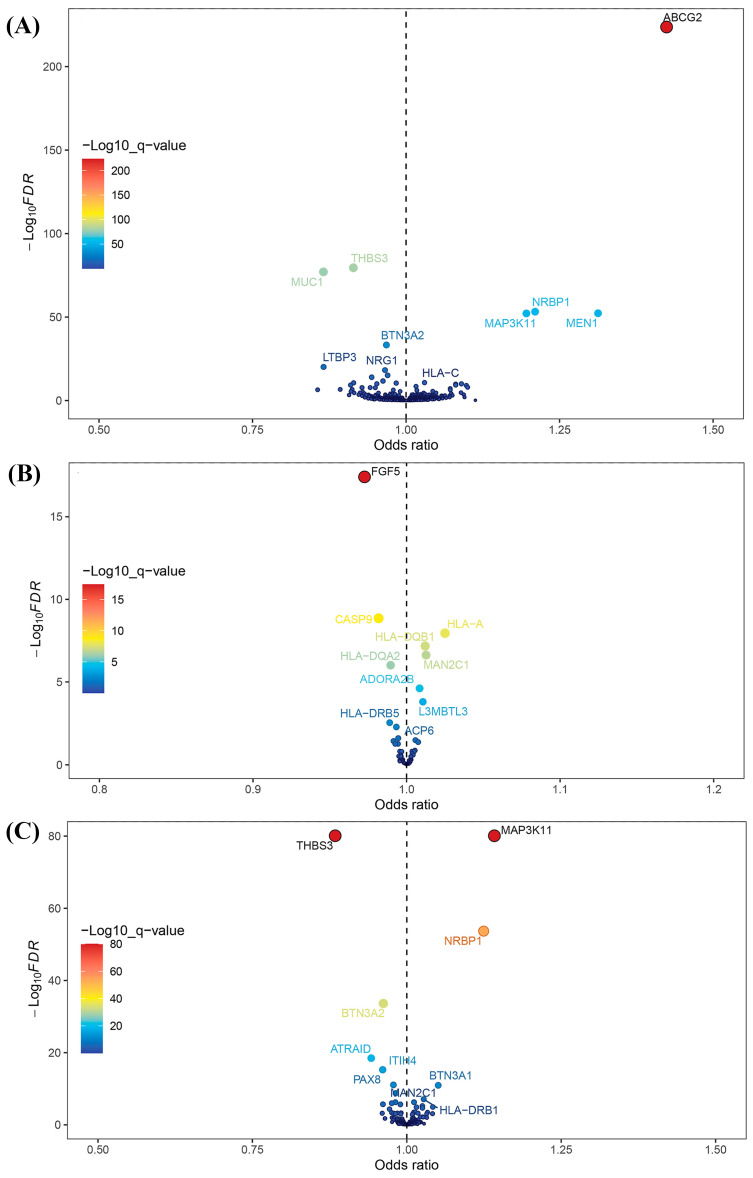
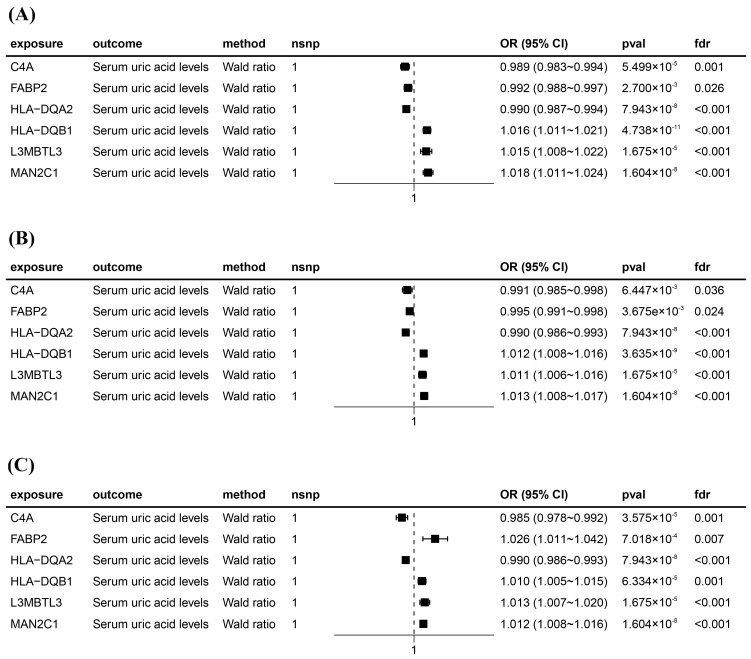
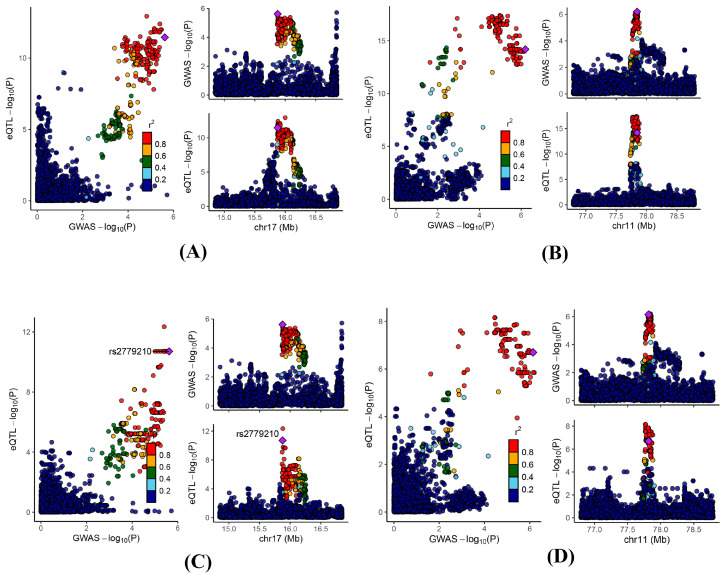
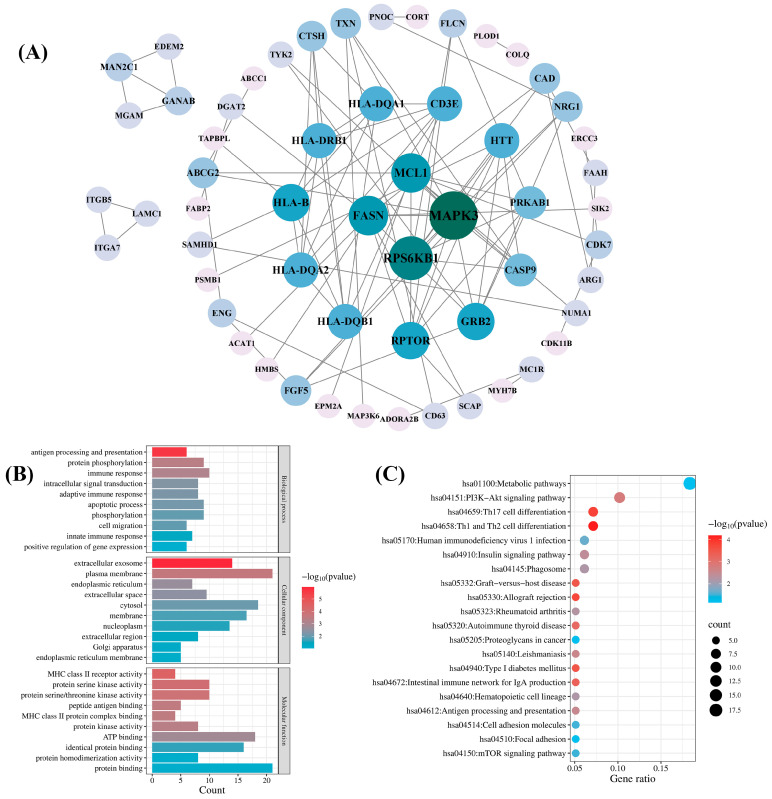
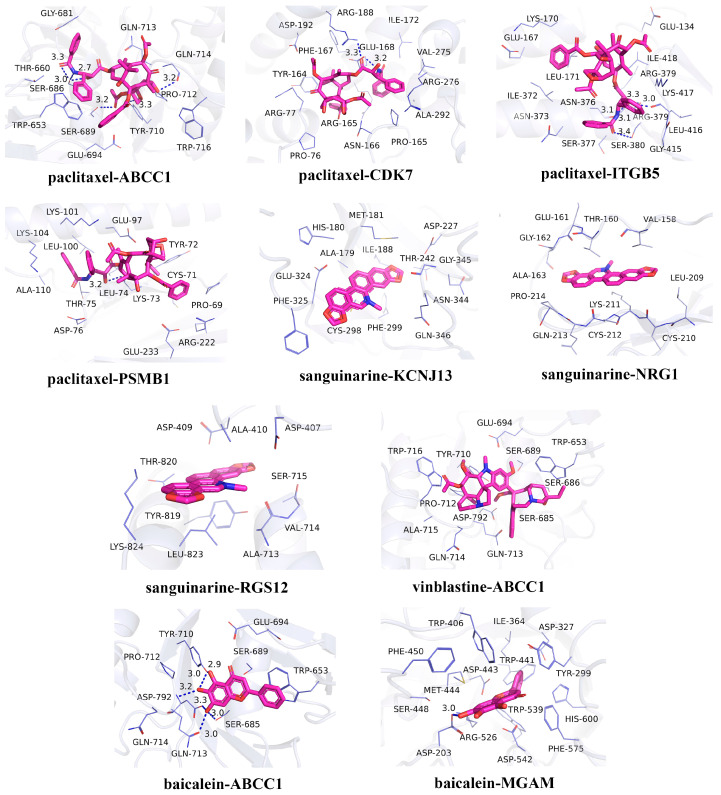
Background: At present, there are still limitations and challenges in the treatment of hyperuricemia (HUA). Mendelian randomization (MR) has been widely used to identify new therapeutic targets. Therefore, we conducted a systematic druggable genome-wide MR to explore potential therapeutic targets and drugs for HUA. Methods: We integrated druggable genome data; blood, kidney, and intestinal expression quantitative trait loci (eQTLs); and HUA-associated genome-wide association study (GWAS) data to analyze the potential causal relationships between drug target genes and HUA using the MR method. Summary-data-based MR (SMR) analysis and Bayesian colocalization were used to assess causality. In addition, we conducted phenome-wide association studies, protein network construction, and enrichment analysis of significant targets to evaluate their biological functions and potential side effects. Finally, we performed drug prediction and molecular docking to identify potential drugs targeting these genes for HUA treatment. Results: Overall, we identified 22 druggable genes significantly associated with HUA through MR, SMR, and colocalization analyses. Among them, two prior druggable genes (ADORA2B and NDUFC2) reached statistically significant levels in at least two tissues in the blood, kidney, and intestine. Further results from phenome-wide studies revealed that there were no potential side effects of ADORA2B or NDUFC2. Moreover, we screened 15 potential drugs targeting the 22 druggable genes that could serve as candidates for HUA drug development. Conclusions: This study provides genetic evidence supporting the potential benefits of targeting 22 druggable genes for HUA treatment, offering new insights into the development of targeted drugs for HUA.
Keywords: Mendelian randomization; colocalization; druggable genes; hyperuricemia; summary-data-based Mendelian randomization.
Conflict of interest statement
The authors declare no conflicts of interest.
Figures
Similar articles
-
Exploring new drug treatment targets for immune related bone diseases using a multi omics joint analysis strategy.Sci Rep. 2025 Mar 27;15(1):10618. doi: 10.1038/s41598-025-94053-7. Sci Rep. 2025. PMID: 40148470 Free PMC article.
-
Mendelian randomization analysis identifies druggable genes and drugs repurposing for chronic obstructive pulmonary disease.Front Cell Infect Microbiol. 2024 Apr 10;14:1386506. doi: 10.3389/fcimb.2024.1386506. eCollection 2024. Front Cell Infect Microbiol. 2024. PMID: 38660492 Free PMC article.
-
Identification of therapeutic target genes for age-related hearing loss through systematic genome-wide mendelian randomization of druggable genes.Exp Gerontol. 2025 Feb;200:112676. doi: 10.1016/j.exger.2025.112676. Epub 2025 Jan 10. Exp Gerontol. 2025. PMID: 39778696
-
Identifying therapeutic target genes for migraine by systematic druggable genome-wide Mendelian randomization.J Headache Pain. 2024 Jun 12;25(1):100. doi: 10.1186/s10194-024-01805-3. J Headache Pain. 2024. PMID: 38867170 Free PMC article.
-
Prioritising genetic findings for drug target identification and validation.Atherosclerosis. 2024 Mar;390:117462. doi: 10.1016/j.atherosclerosis.2024.117462. Epub 2024 Jan 26. Atherosclerosis. 2024. PMID: 38325120 Review.
References
-
- Rivera-Paredez B., Macías-Kauffer L., Fernandez-Lopez J.C., Villalobos-Comparán M., Martinez-Aguilar M.M., de la Cruz-Montoya A., Ramírez-Salazar E.G., Villamil-Ramírez H., Quiterio M., Ramírez-Palacios P., et al. Influence of genetic and non-genetic risk factors for serum uric acid levels and hyperuricemia in Mexicans. Nutrients. 2019;11:1336. doi: 10.3390/nu11061336. - DOI - PMC - PubMed
Grants and funding
LinkOut - more resources
Full Text Sources
