. 2025 May 3;13(5):1109.
doi: 10.3390/biomedicines13051109.

Patient-Oriented In Vitro Studies in Duchenne Muscular Dystrophy: Validation of a 3D Skeletal Muscle Organoid Platform

Affiliations

Patient-Oriented In Vitro Studies in Duchenne Muscular Dystrophy: Validation of a 3D Skeletal Muscle Organoid Platform

Raffaella Quarta et al. Biomedicines. .

Abstract

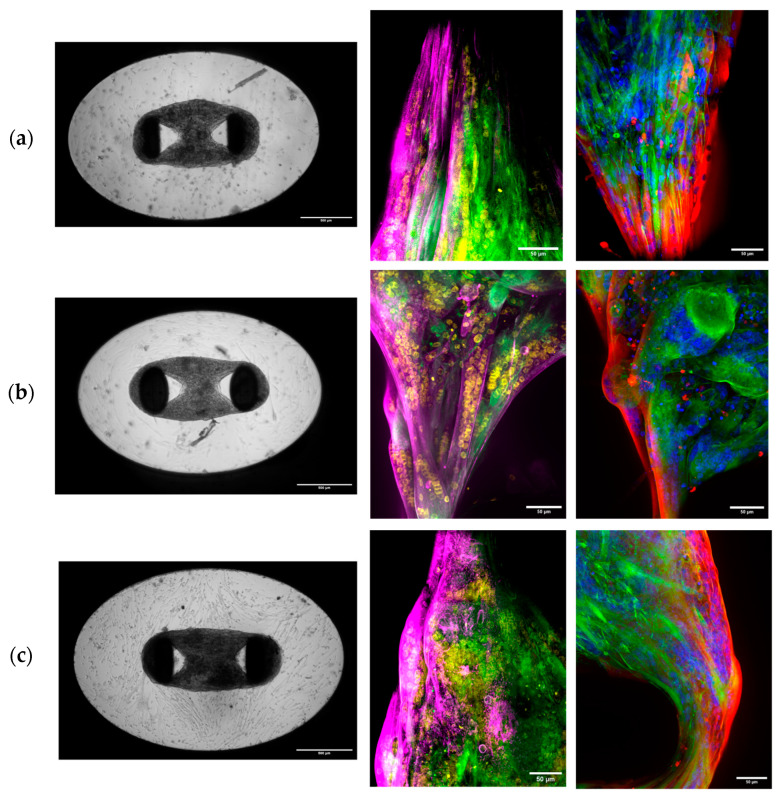
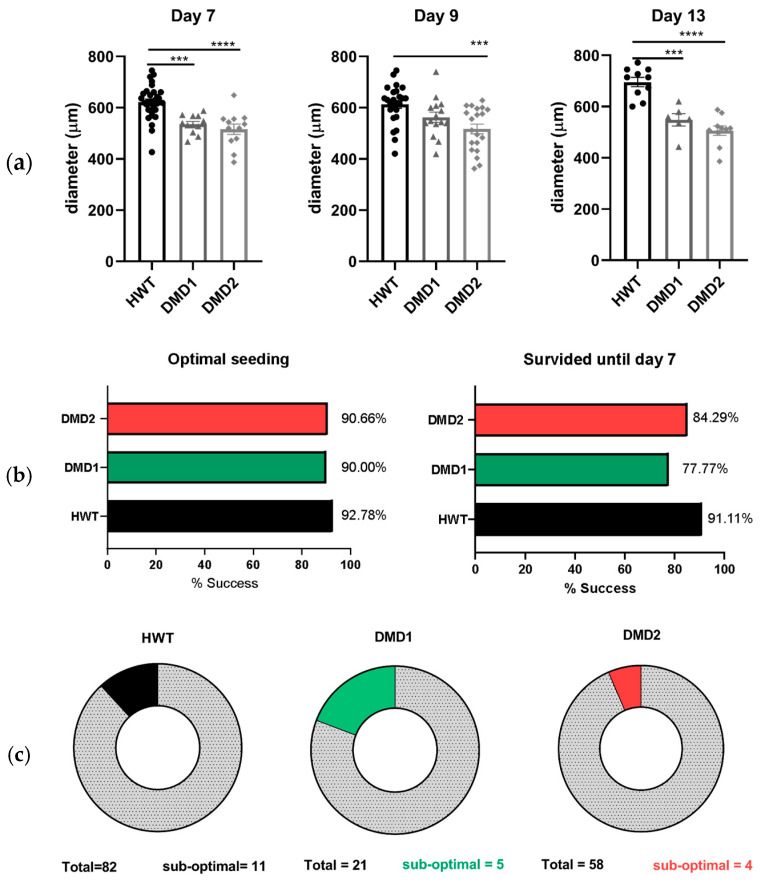
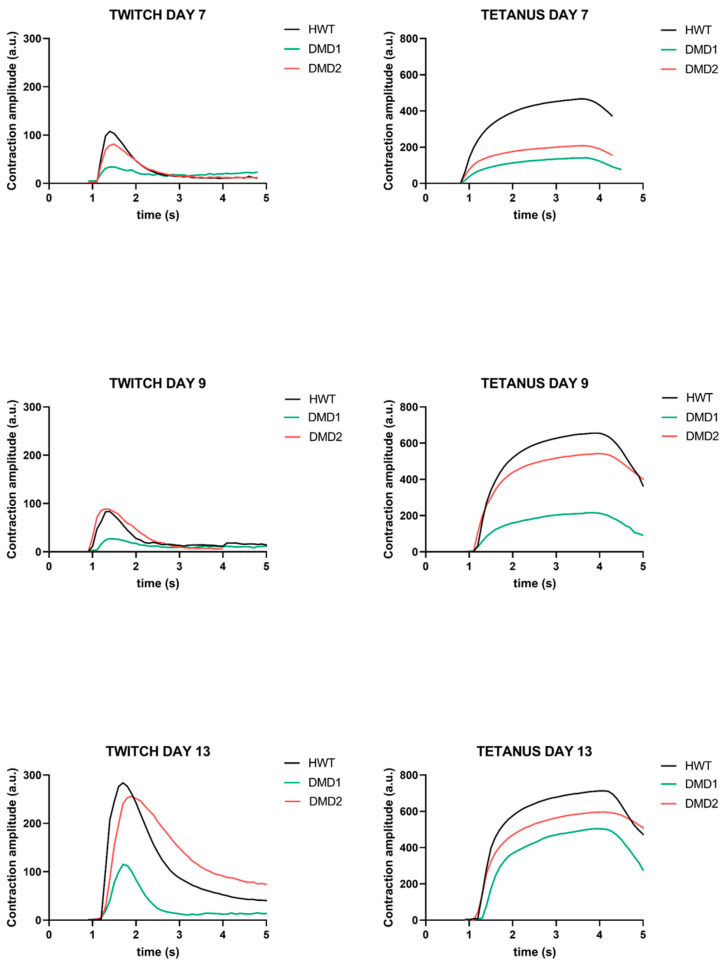
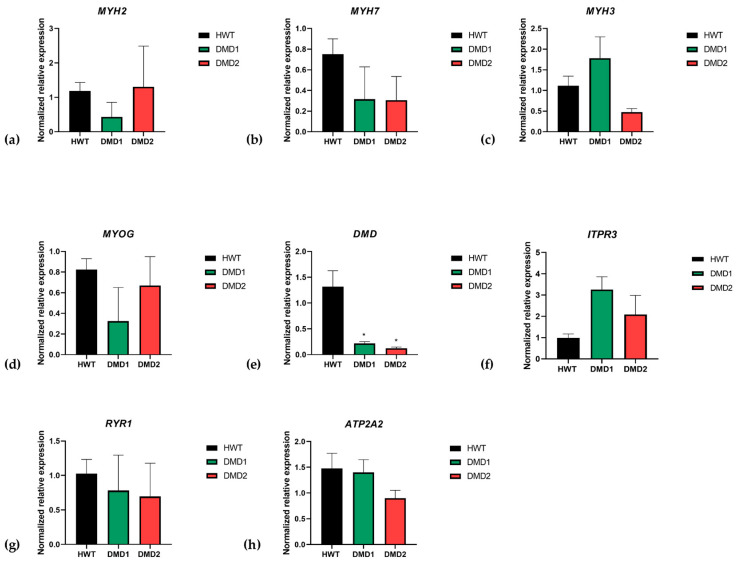
Background: Three-dimensional skeletal muscle organoids (3D SkMO) are becoming of increasing interest for preclinical studies in Duchenne muscular dystrophy (DMD), provided that the used platform demonstrates the possibility to form functional and reproducible 3D SkMOs, to investigate on potential patient-related phenotypic differences. Methods: In this study, we employed fibrin-based 3D skeletal muscle organoids derived from immortalized myogenic precursors of DMD patients carrying either a stop codon mutation in exon 59 or a 48-50 deletion. We compared dystrophic lines with a healthy wild-type control (HWT) by assessing microtissue formation ability, contractile function at multiple timepoints along with intracellular calcium dynamics via calcium imaging, as well as expression of myogenic markers. Results: We found patient-specific structural and functional differences in the early stages of 3D SkMO development. Contractile force, measured as both single twitch and tetanic responses, was significantly lower in dystrophic 3D SkMOs compared to HWT, with the most pronounced differences observed at day 7 of differentiation. However, these disparities diminished over time under similar culturing conditions and in the absence of continuous nerve-like stimulation, suggesting that the primary deficit lies in delayed myogenic maturation, as also supported by gene expression analysis. Conclusions: Our results underline that, despite the initial maturation delay, DMD muscle precursors retain the capacity to form functional 3D SkMOs once this intrinsic lag is overcome. This suggests a critical role of dystrophin in early myogenic development, while contraction-induced stress and/or an inflammatory microenvironment are essential to fully recapitulate dystrophic phenotypes in 3D SkMOs.

Keywords: 3D skeletal muscle organoid; Duchenne muscular dystrophy; disease modeling; immortalized human myoblast; tissue engineering.


Conflict of interest statement

Authors from BIOND Solutions B.V. had a supporting role in the study design and manuscript revision. All other authors declare no competing interests.

Figures

Figure 1
Figure 1
Representative images of 3D SkMOs on day 13 of differentiation. On the left: (a) HWT, (b) DMD2, and (c) DMD1. Scale bar 500 μm. Confocal immunofluorescence imaging of tissues’ sections at day 9 of differentiation showing sarcomeric α-actinin (magenta), F-actin (green), and nuclei (yellow) on the left panel and myosin II heavy chain (red), F-actin (green), and nuclei (blue) on the right. Apparent aggregates, due to unspecific staining, are noticeable in some images. Scale bar 50 μm. Immunofluorescence image of a full-length 3D SkMO is shown in Figure S5.
Figure 2
Figure 2
(a) Bar graphs presenting diameter values for each 3D SkMO at every timepoint. All data are presented as mean ± standard error of the mean (SEM). Multiple statistical comparisons between groups were performed by ordinary one-way ANOVA analysis with Dunnett’s multiple comparisons post hoc correction. Day 7: HWT vs. DMD1 *** p = 0.0003, HWT vs. DMD2 **** p < 0.0001. Day 9: HWT vs. DMD2 *** p = 0.0003. Day 13: HWT vs. DMD1 *** p = 0.0001, HWT vs. DMD2 **** p < 0.0001. (b) Bar graphs showing percentage of seeding success (left) and percentage of survival until 7 (right). (c) Pie charts showing the sub-optimal population for each cell line.
Figure 3
Figure 3
Representative contraction curves in response to EPS showing twitch-like contractions (on the left) and tetanic contractions (on the right) overlapping for each line.
Figure 4
Figure 4
Maximum contraction values for twitch (single 10 ms pulse at 5 V) and tetanic responses (5 V, 10 ms pulses at 30 Hz) at three differentiation timepoints. Each 3D SkMO’s contraction amplitude was normalized using their diameter. (a,b) Day 7: twitch (HWT n = 22, DMD1 n = 12, DMD2 n = 10), tetanus (HWT n = 27, DMD1 n = 12, DMD2 n = 12). (c,d) Day 9: twitch (HWT n = 25, DMD1 n = 15, DMD2 n = 17), tetanus (HWT n = 25, DMD1 n = 15, DMD2 n = 20). (e,f) Day 13: twitch (HWT n = 10, DMD1 n = 6, DMD2 n = 10), tetanus (HWT n = 10, DMD1 n = 6, DMD2 n = 10). (gi) Twitch/Tetanus ratio for each timepoint. (jl). Fatigue was measured in a bundle subset as the drop of force between each pulse compared to the first one in percentage of the maximum force generated at each pulse. Day 7: HWT n = 3, DMD1 n = 4, DMD2 n = 3. Day 9: HWT n = 6, DMD1 n = 5, DMD2 n = 4. Day 13: HWT n = 4, DMD1 n = 3, DMD2 n = 4. All data are expressed as mean ± SEM. Multiple statistical comparisons between groups were performed by one-way Brown–Forsythe ANOVA analysis with Dunnett’s multiple comparisons test post hoc correction: * p = 0.0191, ** p < 0.01, **** p < 0.0001.
Figure 5
Figure 5
Calcium transient values expressed as maximum values of normalized fluorescent signal elicit by (a) 1 Hz and (b) 30 Hz EPS. Data are presented as mean ± (SEM): 1 Hz day 9: HWT (n = 6), DMD1 (n = 6), DMD2 (n = 6); 30 Hz day 9: HWT (n = 4), DMD1 (n = 4), DMD2 (n = 4); 1 Hz day 13: HWT (n = 5), DMD1 (n = 3), DMD2 (n = 6); 30 Hz day 13: HWT (n = 5), DMD1 (n = 3), DMD2 (n = 6). Significant differences were assessed by one-way ANOVA with Dunnet’s multiple comparison correction. (a) One hertz at day 9: HWT vs. DMD2 ** p = 0.0011, HWT vs. DMD1 ** p = 0.0045. (b) Thirty hertz at day 9: HWT vs. DMD2 ** p = 0.0036. (b) Thirty hertz at day 13: HWT vs. DMD1 * p = 0.038. (cg) Calcium transient responses to EPS through the application of a frequency range of 1 Hz, 2 Hz, 5 Hz, 10 Hz, and 30 Hz at day 13.
Figure 6
Figure 6
RT-PCR analysis in muscle microtissues of (a) MYH2 (HWT n = 3, DMD1 n = 3, DMD2 n = 2), (b) MYH7 (HWT n = 3, DMD1 n = 2, DMD2 n = 2), (c) MYH3 (HWT n = 3, DMD1 n = 3, DMD2 n = 2), (d) MYOG (HWT n = 3, DMD1 n = 2, DMD2 n = 2), (e) DMD (HWT n = 3, DMD1 n = 3, DMD2 n = 2) HWT vs. DMD 1 (* p = 0.0183) and HWT vs. DMD2 (* p = 0.0207), (f) ITPR3 (HWT n = 3, DMD1 n = 2, DMD2 n = 2), (g) RYR1 (HWT n = 3, DMD1 n = 3, DMD2 n = 2), and (h) ATP2A2 (HWT n = 3, DMD1 n = 2, DMD2 n = 2). Data are expressed as mean ± SEM. Significant differences were assessed by ANOVA with Dunnet’s multiple comparison correction.
Figure 7
Figure 7
(a) Schematic representation of experimental setup: (b) One hertz contraction before introducing the inhibitor. (c) Contraction diminished over time after 4 min of BDM flowing in and contraction was restored over time during BDM wash out. (d) Fluorescence signal expressed as percentage decreasing during wash out. Data were collected from two independent experiments, and the values are presented as mean ± SEM (shown in green).

Similar articles

References

    1. Mendell J.R., Shilling C., Leslie N.D., Flanigan K.M., Al-Dahhak R., Gastier-Foster J., Kneile K., Dunn D.M., Duval B., Aoyagi A., et al. Evidence-based path to newborn screening for Duchenne muscular dystrophy. Ann. Neurol. 2012;71:304–313. doi: 10.1002/ana.23528. - DOI - PubMed
    1. Hoffman E.P., Brown R.H., Jr., Kunkel L.M. Dystrophin: The protein product of the Duchenne muscular dystrophy locus. Cell. 1987;51:919–928. doi: 10.1016/0092-8674(87)90579-4. - DOI - PubMed
    1. Jaber A., Palmieri L., Gicquel E., Richard I., Israeli D. Advances and Challenges in Microdystrophin gene therapy for Duchenne Muscular Dystrophy: Progress and future directions. Med. Sci. 2024;40:46–51. doi: 10.1051/medsci/2024138. - DOI - PubMed
    1. Duan D., Goemans N., Takeda S., Mercuri E., Aartsma-Rus A. Duchenne muscular dystrophy. Nat. Rev. Dis. Primers. 2021;7:13. doi: 10.1038/s41572-021-00248-3. - DOI - PMC - PubMed
    1. Gao Q.Q., McNally E.M. The Dystrophin Complex: Structure, Function, and Implications for Therapy. Compr. Physiol. 2015;5:1223–1239. doi: 10.1002/j.2040-4603.2015.tb00638.x. - DOI - PMC - PubMed

LinkOut - more resources