. 2025 May 6;13(5):1119.
doi: 10.3390/biomedicines13051119.

Regulation of Kv2.1 Channels by Kv9.1 Variants

Affiliations

Regulation of Kv2.1 Channels by Kv9.1 Variants

Hedaythul Choudhury et al. Biomedicines. .

Abstract

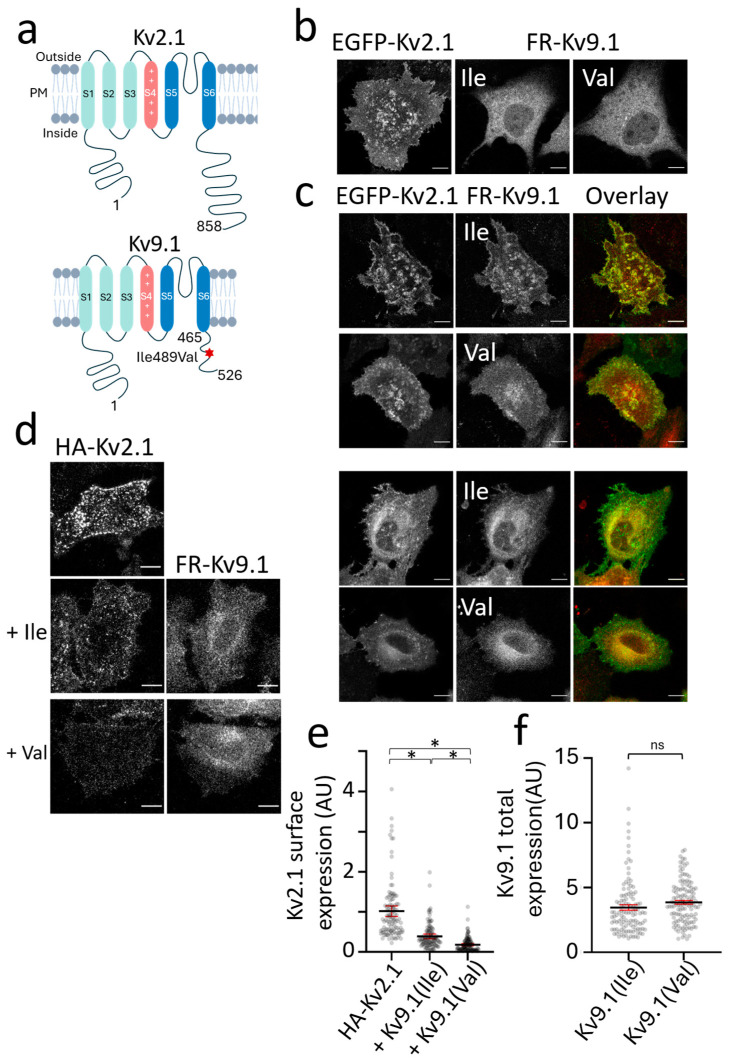
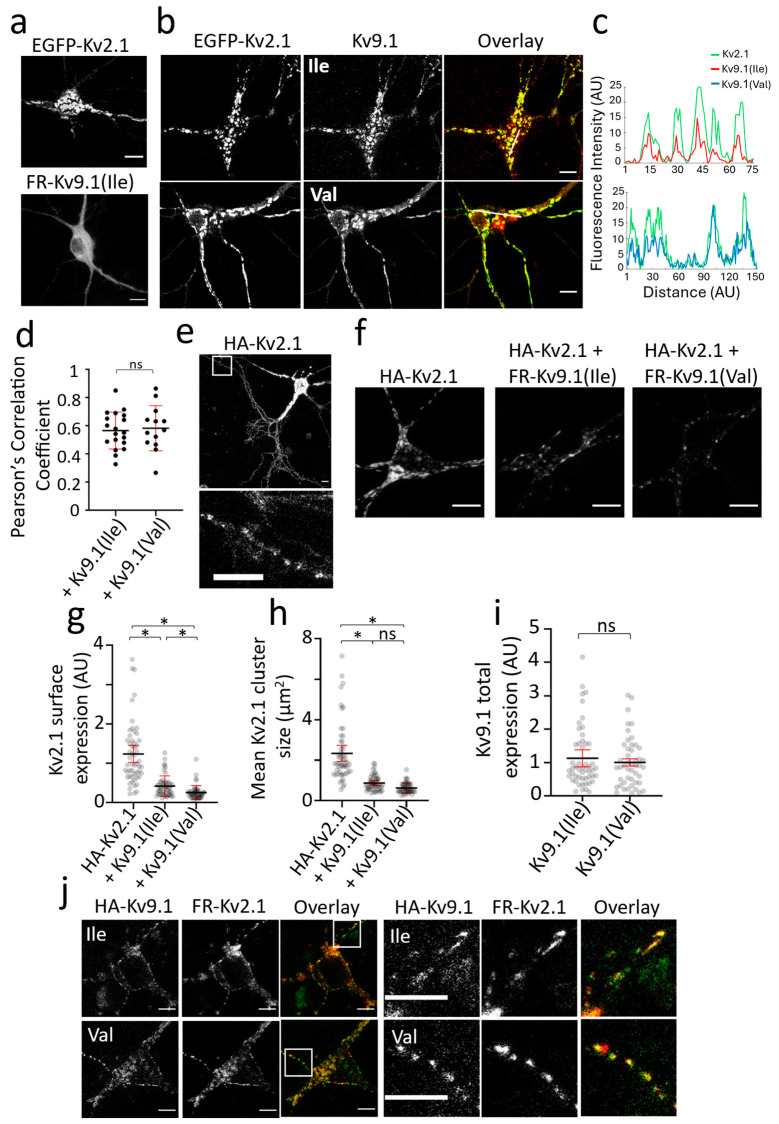
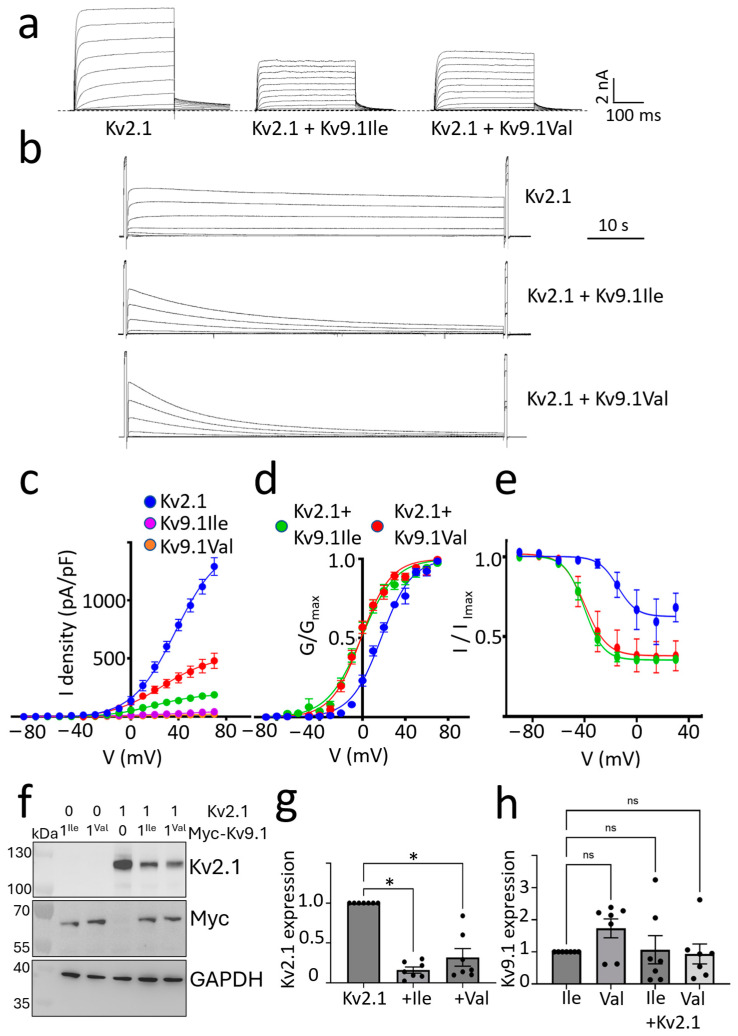
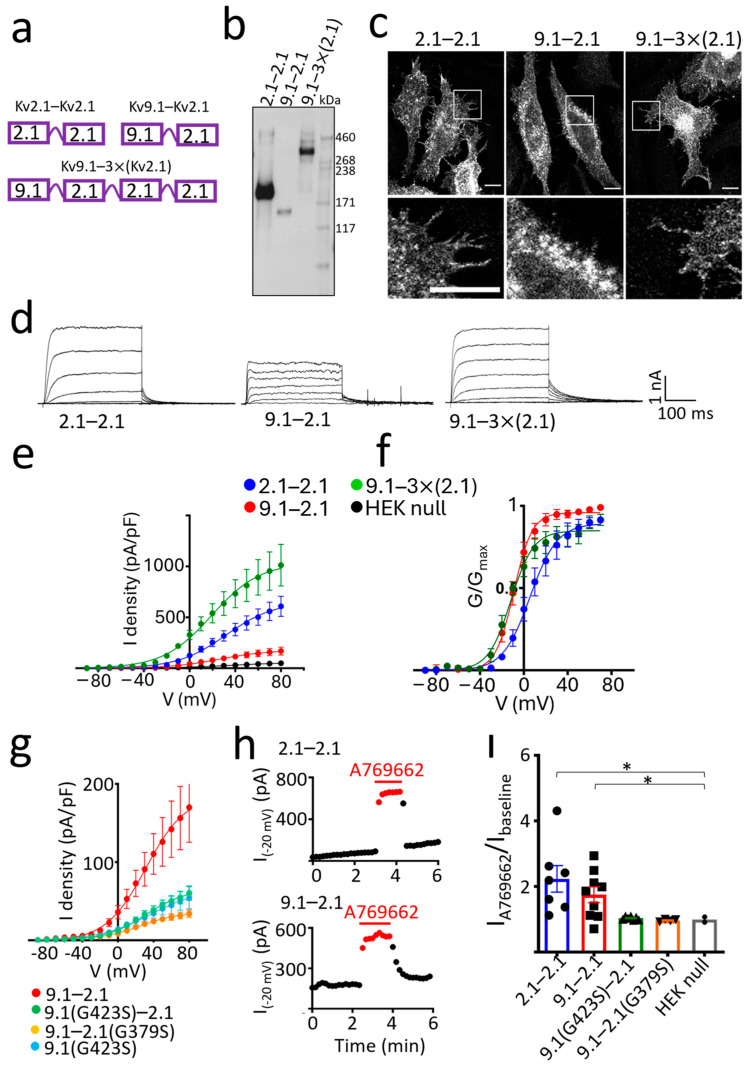
Background/Objectives: Kv2 channels have important conducting and nonconducting functions and are regulated by their co-assembly with 'silent' Kv subunits, including Kv9.1. Kv9.1 is co-expressed with Kv2 channels in sensory neurons, and a common allele that changes Ile489 to Val in human Kv9.1 is associated with pain hypersensitivity in patients. The mechanism responsible for this association remains unknown, but we hypothesise that these two variants differ in their regulation of Kv2.1 properties, and this is what we set out to test. Methods: Expression was carried out using HEK293 cells, OHeLa cells, and primary cultures of hippocampal neurons, and the biophysical and trafficking properties of homomeric and heteromeric channels were assessed by confocal fluorescence microscopy and patch clamp analysis. Results: Both Kv9.1Ile and Kv9.1Val were retained within the endoplasmic reticulum when expressed individually, but when co-expressed with Kv2.1, they co-localised with Kv2.1 within the surface clusters. Both variants reduced the surface expression of Kv2.1 channels and the size of channel clusters, with Kv9.1Val producing a greater reduction in surface expression in both the HeLa cells and neurons. They both caused a similar hyperpolarising shift in the voltage dependence of channel activation and inactivation. Concatamers of Kv2.1 and Kv9.1 suggested that both 3:1 and 2:2 ratios of Kv2.1 to Kv9.1 were permitted, although 2:2 resulted in lower surface expression and function. Conclusions: The Ile489Val substitution in Kv9.1 does not disrupt its ability to co-assemble with Kv2 channels, nor its effects on the voltage-dependence of channel gating, but it did produce a greater reduction in the Kv2.1 surface expression, suggesting that this underlies its association with pain hypersensitivity.

Keywords: Kv2 potassium channels; fluorescence imaging; neurons; pain; patch clamp electrophysiology.


Conflict of interest statement

The authors declare no competing interests.

Figures

Figure 1
Figure 1
Reduction in Kv2.1 surface expression upon co-expression with either the Kv9.1Ile or Kv9.1Val variant in HeLa cells. (a) A graphic depicting the transmembrane topology of human Kv2.1 and Kv9.1, with the position of the Kv9.1 SNP Ile49Val indicated within the middle of the cytoplasmic C-terminal region (*). (b) Confocal images of live HeLa cells expressing EGFP-Kv2.1, FR-Kv9.1Ile, and FR-Kv9.1Val. (c) Cells in which EGFP-Kv2.1 was co-expressed with either FR-Kv9.1 variant showed two different phenotypes, either increased expression of Kv9.1 at the cell surface and within clusters that overlapped with Kv2.1 clusters (top panels) or increased retention of Kv2.1 within the ER as indicated by the clear outline of the nucleus (bottom panels). (d) Surface labelling of HA-Kv2.1 with anti-HA antibody in live cells, when expressed alone (top image) and when co-expressed with either FR-Kv9.1Ile or FR-Kv9.1Val. (e) Quantification of the anti-HA immunofluorescence intensity per cell was used to determine the relative surface expression of HA-Kv2.1 when expressed alone (n = 112), together with FR-Kv9.1Ile (n = 115) or together with FR-Kv9.1Val (n = 123); N = 3, three independent passages. The lines represent the mean values with error bars indicating a 95% confidence interval. Nested one-way ANOVA (* p < 0.5); by Tukey’s multiple comparisons test. (f) In these experiments, the expression of FR-Kv9.1Ile and FR-Kv9.1Val was determined from the intensity of FR fluorescence per cell. Nested t-test indicates no significant difference between the two variants. The lines represent the mean with error bars indicating a 95% confidence interval (n = 115 and 123 cells for HA-Kv2.1 plus FR-Kv9.1Ile and HA-Kv2.1 plus FR-Kv9.1Val, respectively; N = 3, three independent passages). All scale bars represent 10 µm. Non-significant results are indicated by ns.
Figure 2
Figure 2
Reduction in Kv2.1 PM expression and cluster size following the co-expression of Kv9.1 variants in hippocampal neurons (a) Representative confocal images of live neurons showing the distinct clustering behaviours of EGFP-Kv2.1 in contrast to the diffuse ER distribution of Kv9.1 variants. (b) In neurons co-expressing Kv2.1 with Kv9.1, the subcellular distribution of both of the Kv9.1 variants changed and they were present in clusters that overlapped with Kv2.1 clusters. (c) Line scan analyses in which fluorescence intensity along the line shown in the overlay images is plotted against distance for Kv2.1 (green), Kv9.1Ile (red), and Kv9.1Val (blue), showing the co-localisation of Kv2.1 and Kv9.1 clusters. (d) Pearson’s correlation coefficients were calculated for each Kv9.1 variant co-expressed with Kv2.1 by drawing ROIs within the cell soma. (e) Surface immunolabelling of HA-Kv2.1 in live neurons using anti-HA antibody showed high expression at the soma and proximal neurites but also clear punctate distribution throughout distal neurites. White inset box is displayed below, showing a zoomed-in area of distal neurites expressing surface puncta of Kv2.1. (f) Representative confocal images show surface labelling of HA-Kv2.1 channels when expressed alone and co-expressed with either FR-Kv9.1Ile or FR-Kv9.1Val. (g,h) The scatterplots show anti-HA immunofluorescence intensity at the soma of each neuron and the mean size of HA-Kv2.1 clusters at the soma, for HA-Kv2.1 alone and when co-expressed with either Kv9.1Ile or Kv9.1Val. The lines represent the mean with error bars indicating a 95% confidence interval (n = 54, 54 and 51 for HA-Kv2.1 alone, plus Kv9.1Ile and plus Kv9.1Val, respectively; N = 3, independent neuronal isolation procedures). Nested one-way ANOVA (* p < 0.05) using Tukey’s multiple comparisons test. (i) The fluorescence intensity of FR-Kv9.1(Ile) and FR-Kv9.1(Val) was measured in each cell used in the analysis of HA-Kv2.1 surface expression, and a nested t-test indicates no significant difference in the expression of the two variants. The line represents the mean with error bar indicating a 95% confidence interval (n = 54 and 51 cells for HA-Kv2.1 plus FR-Kv9.1Ile and HA-Kv2.1 plus FR-Kv9.1Val, respectively; N = 3, independent neuronal isolation procedures). (j) Representative images of anti-HA immunolabelling of HA-Kv9.1Ile and HA-Kv9.1Val co-expressed with FR-Kv2.1 in live neurons. Both variants of Kv9.1 were expressed within surface clusters (green) that overlapped with Kv2.1 clusters (red) both at the soma and within neurites. White inset box is displayed to the right, showing a zoomed-in area of neurites expressing surface clusters of Kv9.1 variants (green) co-localised with Kv2.1 clusters (red). All scale bars represent 10 µm. Non-significant results are indicated by ns.
Figure 3
Figure 3
Co-expression of either Kv9.1Ile or Kv9.1Val with Kv2.1, reduced peak current density and Kv2.1 expression and shifted the voltage dependence of current activation and inactivation in the hyperpolarising direction. (a) Representative current traces recorded from HEK293 cells transfected with the indicated channel subunits. Currents were evoked by stepping from −100 mV to between −80 mV and +70 mV in 10 mV steps for 300 ms and then back to −40 mV to measure tail currents. (b) Representative current traces evoked by stepping the voltage for 30 s from between −80 mV to +25 mV in 15 mV steps. A 300 ms test pulse to +50 mV was applied immediately before and after this, and the peak current amplitudes were compared. (c) The mean ± SEM of peak current densities measured at different test voltages using the protocol described in (a). Expression of either Kv9.1Ile or Kv9.1Val alone did not give rise to functional channels (n = 3). Co-expression of either Kv9.1 variant with Kv2.1 reduced the peak current density compared to Kv2.1 expressed alone (n = 5 for Kv2.1 alone, n = 11 for Kv2.1 with Kv9.1Ile and n = 14 for Kv2.1 with Kv9.1Val). (d) The normalised conductance-voltage relationships with a Boltzmann curve fitted to the data for Kv2.1 alone and Kv2.1 co-expressed with Kv9.1 variants. V50 values (mean ± 95% CI) were 17.6 ± 1.35 mV (n = 5) for Kv2.1 alone, −1.1 ± 1.8 mV (n = 11) for Kv2.1 with Kv9.1Ile and −1.2 ± 1.4 mV (n = 14) for Kv2.1 with Kv9.1Val. (e) The voltage dependence of steady-state inactivation measured according to the voltage protocol described in B with Boltzmann curves fitted to the data shows the hyperpolarising shift produced by both variants of Kv9.1. V50 values (mean ± 95% CI) were −14.6 ± 11.8 mV (n = 4) for Kv2.1 alone, −39.9 ± 9.1 mV (n = 5) for Kv2.1 with Kv9.1Ile and −40.2 ± 2.8 mV (n = 8) for Kv2.1 with Kv9.1Val. (f) Western blot comparing expression of Kv2.1, Kv9.1Ile and Kv9.1Val alone and when co-expressed. (g) The mean ± SEM for Kv2.1 corrected for GAPDH expression and then for each experiment normalised to Kv2.1 alone. (h) The expression of Kv9.1 was corrected for GAPDH expression, and each experiment was then normalised to Kv9.1Ile alone (n = 4). To test for statistical significance, the non-normalised data were log-transformed for a normal distribution, and statistical significance was tested using a one-way ANOVA with repeated measures followed by Dunnett’s test to assess differences between groups. The reduction in Kv2.1 expression in the presence of either Kv9.1Ile or Kv9.1Val was significant (* p < 0.05), whereas there was no significant change in the expression of the Kv9.1 variants in the presence of Kv2.1. Non-significant results are indicated by ns.
Figure 4
Figure 4
Concatamers of Kv9.1 and Kv2.1 suggest that both a 2:2 and 1:3 stoichiometry is permitted for Kv9.1−Kv2.1 heteromeric complexes. (a) Design of dimers comprising Kv2.1 linked to Kv2.1 (2.1−2.1) (top left) and Kv9.1Ile linked to Kv2.1 (9.1−2.1) (top right) and a tetrameric concatemer encoding one Kv9.1Ile linked to three Kv2.1 subunits (9.1−3×(2.1)) (bottom). (b) Dimers of 2.1−2.1 and 9.1−2.1 and the tetrameric concatemer 9.1−3×(2.1) were expressed in HEK293 cells, and surface proteins were purified by biotinylation and isolation on streptavidin resin and probed with anti-Kv2.1 antibody following separation on a 3–8% Tris acetate gel. (c) Immunostaining with anti-Kv2.1 following expression of the concatamers in HeLa cells showed PM expression for all but greater retention of the 9.1−2.1 dimer within the ER as evidenced by the outline of the nucleus. White inset box is displayed below, showing a zoomed-in area of cells highlighting the PM expression of 2.1−2.1 and 9.1−3×(2.1) and the ER retention of 9.1−2.1. (d) Representative whole cell currents recorded from HEK293 cells were evoked by stepping the membrane potential from −100 mV to between −40 mV and +20 mV in 10 mV steps for 300 ms. Tail currents were measured at −40 mV. (e) Peak current densities were calculated, and cells expressing the 9.1−2.1 dimer had reduced currents compared to the 2.1−2.1 dimer and 9.1−3×(2.1) tetramer (n = 8 for 2.1−2.1, n = 7 for 9.1−2.1, n = 7 for 9.1−3×(2.1)). (f) The hyperpolarising shift in the voltage dependence of channel activation for both 9.1−2.1 and 9.1−3×(2.1) compared to the 2.1−2.1 dimer. V50 values (mean ± 95% CI) were 5.7 ± 4.4 mV (n = 8) for 2.1−2.1, −9.1 ± 1.8 mV (n = 7) for 9.1−2.1, and −11.8 ± 3.0 mV (n = 7) for 9.1−3×(2.1). (g) Mutations were made in either the Kv9.1 subunit (G423S) or Kv2.1 subunit (G379S) of the 9.1−2.1 dimer. Both mutations reduced the peak current densities to a level similar to cells expressing Kv9.1(G423S) alone (n = 9 for 9.1−2.1, n = 7 for 9.1G423S-2.1, n = 4 for 9.1−2.1G379S, n = 3 for Kv9.1G423S). (h) Currents were evoked by stepping the voltage from a holding potential of −100 mV to −20 mV at 5 s intervals, and peak current amplitudes were measured before, during and after washout of the AMPK activator A769662 (100 µM) and plotted as a function of time. Onset and recovery of the potentiating effect of A769662 were rapid. Results are shown for the 2.1−2.1 dimer (top graph) and the 9.1−2.1 dimer (bottom graph). (i) The fold increase in the peak current amplitude in the presence of A769662 is shown for 2.1−2.1, 9.1−2.1 and both mutant 9.1−2.1 dimers, with individual data points shown plus the mean ± SEM. A Welch’s ANOVA was performed, followed by post-hoc comparisons using Dunnett’s T3 test, * p < 0.05.

Similar articles

References

    1. Tsantoulas C., McMahon S.B. Opening paths to novel analgesics: The role of potassium channels in chronic pain. Trends Neurosci. 2014;37:146–158. doi: 10.1016/j.tins.2013.12.002. - DOI - PMC - PubMed
    1. Trimmer J.S. Ion channels and pain: Important steps towards validating a new therapeutic target for neuropathic pain. Exp. Neurol. 2014;254:190–194. doi: 10.1016/j.expneurol.2014.01.019. - DOI - PMC - PubMed
    1. Rasband M.N., Park E.W., Vanderah T.W., Lai J., Porreca F., Trimmer J.S. Distinct potassium channels on pain-sensing neurons. Proc. Natl. Acad. Sci. USA. 2001;98:13373–13378. doi: 10.1073/pnas.231376298. - DOI - PMC - PubMed
    1. Bocksteins E., Raes A.L., Van de Vijver G., Bruyns T., Van Bogaert P.-P., Snyders D.J. Kv2. 1 and silent Kv subunits underlie the delayed rectifier K+ current in cultured small mouse DRG neurons. Am. J. Physiol.-Cell Physiol. 2009;296:C1271–C1278. doi: 10.1152/ajpcell.00088.2009. - DOI - PMC - PubMed
    1. Tsantoulas C., Zhu L., Yip P., Grist J., Michael G.J., McMahon S.B. Kv2 dysfunction after peripheral axotomy enhances sensory neuron responsiveness to sustained input. Exp. Neurol. 2014;251:115–126. doi: 10.1016/j.expneurol.2013.11.011. - DOI - PMC - PubMed

LinkOut - more resources