. 2025 May 20;13(5):1249.
doi: 10.3390/biomedicines13051249.

Bioinformatics-Guided Experimental Validation Identifies NQO1 as a Senescence-Ferroptosis Hub in Liver Fibrosis

Affiliations

Bioinformatics-Guided Experimental Validation Identifies NQO1 as a Senescence-Ferroptosis Hub in Liver Fibrosis

Xinying Zhang et al. Biomedicines. .

Abstract

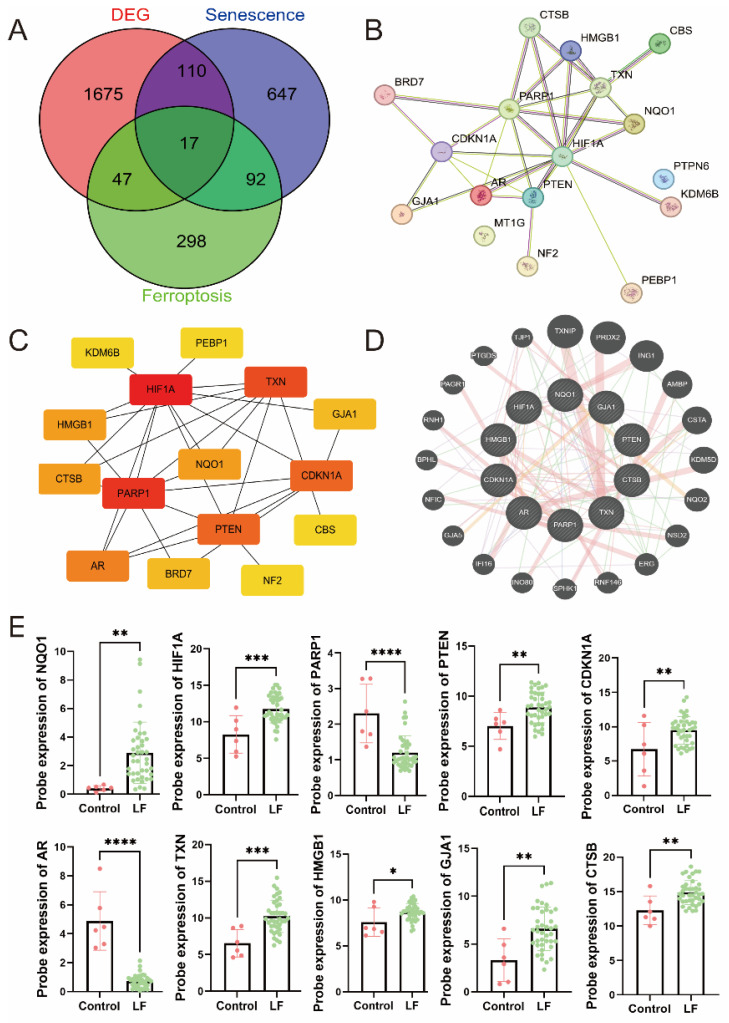
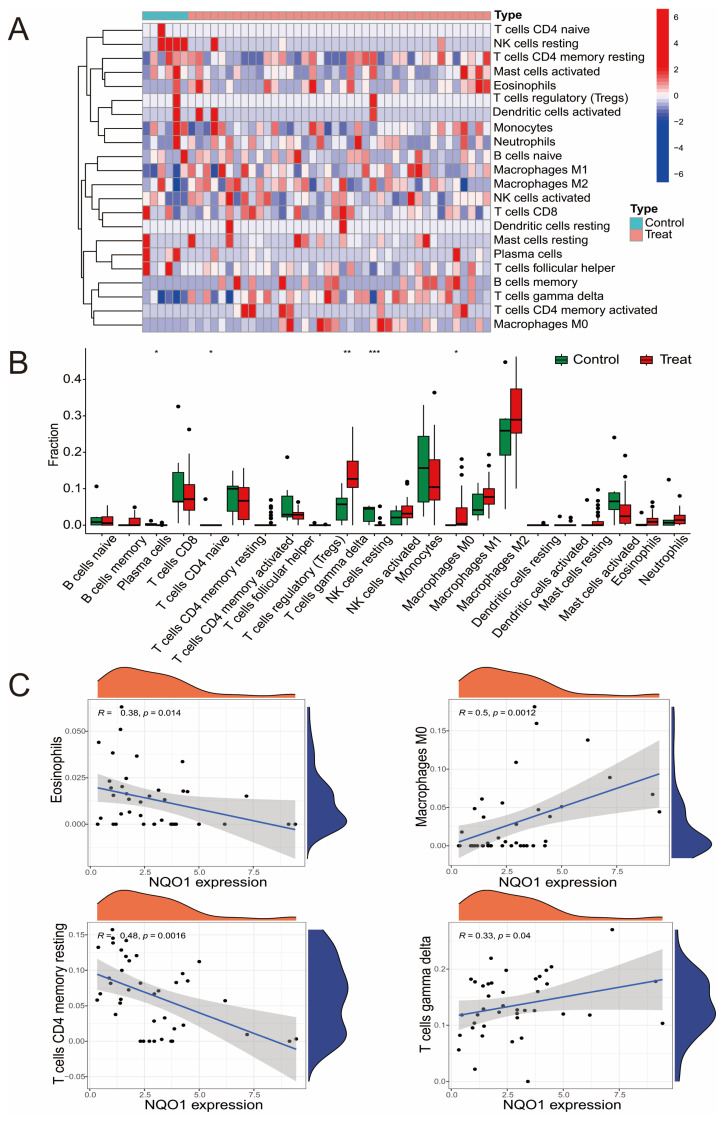
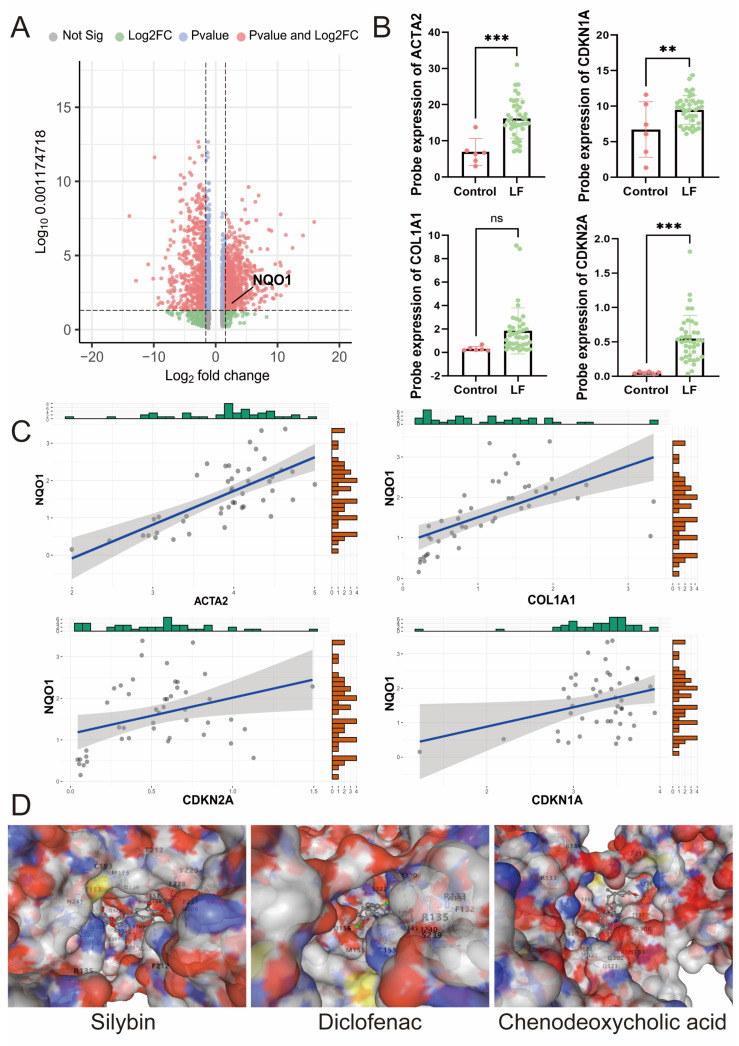
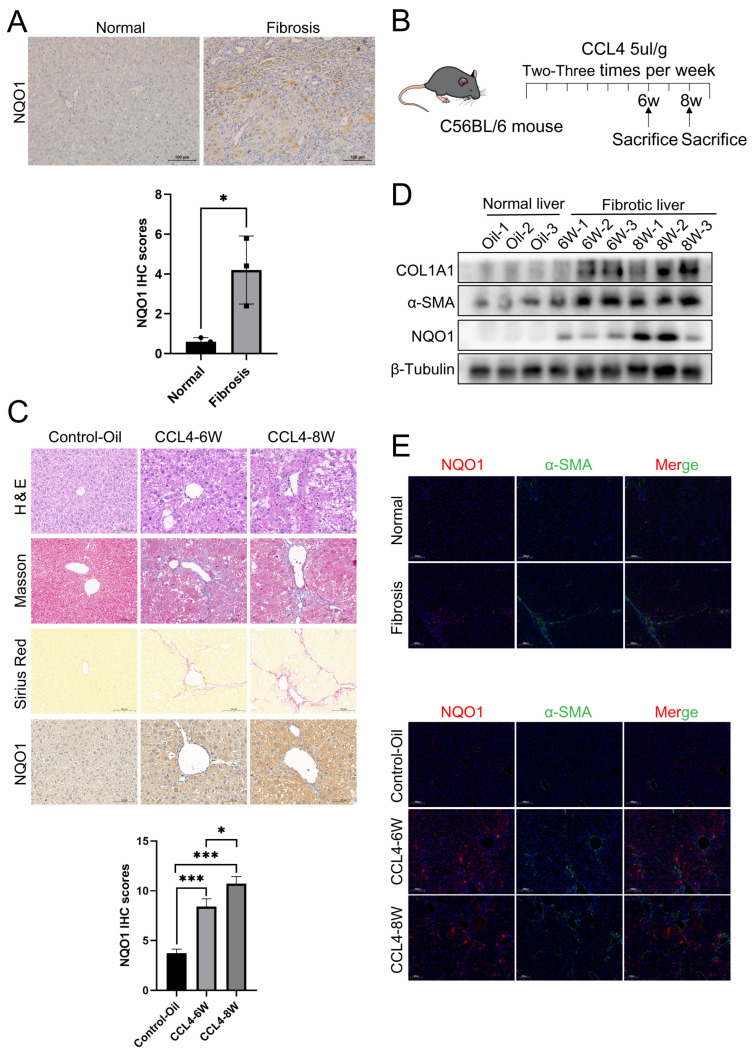
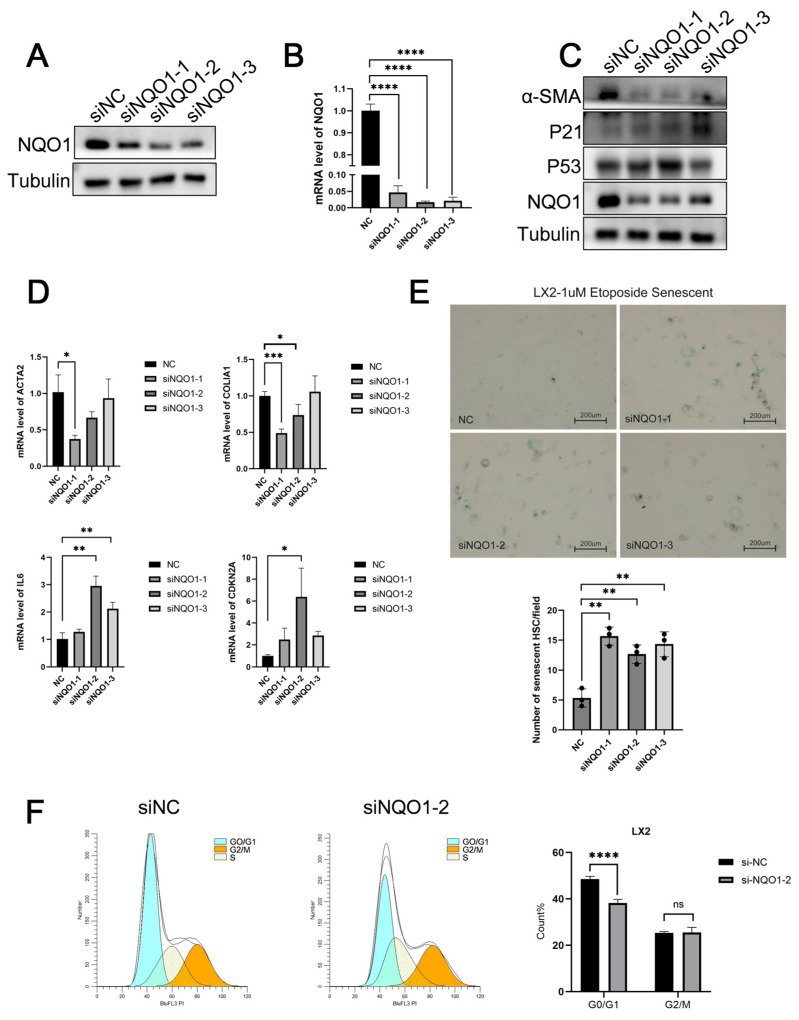
Background: As a pivotal point for the development of liver diseases, liver fibrosis (LF) is closely associated with cellular senescence and ferroptosis. However, there is a lack of effective markers that accurately predict LF status. This study aims to identify key genes involved in LF through bioinformatics analysis and experimental validation. Methods: We used bioinformatics analysis of Gene Expression Omnibus (GEO) data to investigate the gene functions, prognostic value, and immune associations of characteristic genes in LF. Functional enrichment analysis of DEGs was performed using GO and KEGG. Immune cell types and their proportions were estimated with CIBERSORTx. In addition, we analyzed the role of NQO1 in LF using IHC, WB, PCR, and flow cytometry. Results: Bioinformatics analysis identified 10 hub genes, including AR, CDKN1A, GJA1, CTSB, HIF1A, HMGB1, NQO1, PARP1, PTEN, and TXN. Among them, NQO1 was strongly correlated with immune cell activity. Experimental validation confirmed that NQO1 is upregulated and promotes αSMA and COL1A1 expression in hepatic stellate cells (HSCs). Knockdown of NQO1 significantly affected the proliferation of HSCs. Conclusions: NQO1 plays a critical role in HSC senescence and ferroptosis, promoting HSC activation and contributing to LF progression. Our findings suggest that NQO1 may serve as a potential biomarker for LF.

Keywords: NQO1; biomarkers; cellular senescence; ferroptosis; immune cells; liver fibrosis.


Conflict of interest statement

The authors declare no conflicts of interest.

Figures

Figure 1
Figure 1
Enrichment analysis of genes related to liver fibrosis (LF), aging, and ferroptosis. (A,B) GO and KEGG enrichment analysis of LF-related genes. (C,D) GO and KEGG enrichment analysis of aging-related genes. (E,F) GO and KEGG enrichment analysis of ferroptosis-related genes.
Figure 2
Figure 2
Identification and analysis of hub DEGs. (A) A Venn diagram of DEGs related to liver fibrosis, aging, and ferroptosis. (B,C) The protein–protein interaction (PPI) network of the DEGs. (D) Co-expression network of hub DEGs. Co-expression network of hub DEGs: different line types represent networks, while varying pie chart colors indicate distinct functions. (E) Probe the expression value of AgDEGs in the LF group and the control group of GSE25097. * p < 0.05, ** p < 0.01, *** p < 0.001, **** p < 0.0001.
Figure 3
Figure 3
The correlation between the hub DEGs and immune cells. (A) The heatmap shows a correlation matrix of 22 immune cell types in LF tissues. The heatmap shows pairwise correlation coefficients between immune cell types, with red representing positive correlations and blue indicating negative correlations. (B) The proportion of immune cells in the LF and control groups. * p < 0.05, ** p < 0.01, *** p < 0.001. (C) The correlation between hub DEG NQO1 and four types of immune cells.
Figure 4
Figure 4
NQO1 expression is increased in liver fibrosis and facilitates the expression of fibrosis markers. (A) Volcano plot illustrating DEGs between the LF group and the control group of GSE25097. Red dots represent significantly upregulated genes, while green dots indicate significantly downregulated genes. NQO1 is prominently upregulated in the LF group. (B) Probe expression value of ACTA2, COL1A1, CDKN1A, and CDKN2A in the LF group and control group of GSE25097. ns: p > 0.05, ** p < 0.01, *** p < 0.001. (C) Correlation analysis of ACTA2, COL1A1, CDKN1A, and CDKN2A with NQO1 in the LF group and control group of GSE25097. (D) Molecular docking between NQO1 and different drugs, silybin, diclofenac, and chenodeoxycholic acid.
Figure 5
Figure 5
The expression of NQO1 is elevated in LF. (A) Representative IHC images showing NQO1 expression in patients with hepatic hemangioma and LF. Scale bar, 100 μm. (B) Flowchart of the LF model using CCL4 (carbon tetrachloride). (C) IHC images for NQO1, H&E, Sirius red, and Masson staining, along with liver tissue anatomy from control-Oil, 6w-CCl4, and 8w-CCl4 mice (n = 5/group). Scale bar, 100 μm. (D) Western blot for NQO1, α-SMA, and COL1A1 in liver tissues from control-Oil, 6w-CCl4, and 8w-CCl4 mice. (E) Immunofluorescence staining showing elevated NQO1 (red) and α-SMA (green) in liver tissue from patients and mice (control-Oil, 6w-CCl4, and 8w-CCl4). Scale bar, 200 μm. Data are expressed as mean ± SD. Statistical analysis was performed using Student’s t-test. * p < 0.05, *** p < 0.001.
Figure 6
Figure 6
NQO1 knockdown induces senescence and suppresses LF. (A) Western blot analysis showing the efficiency of NQO1 siRNA knockdown in LX-2 cells. (B) qPCR analysis confirming the knockdown efficiency of NQO1 siRNA in LX-2 cells. (C) Western blot analysis assessing the expression levels of NQO1, α-SMA, COL1A1, p53, and p21 in LX-2 cells after NQO1 knockdown. (D) qPCR analysis of gene expression levels of ACTA2, α-SMA, COL1A1, IL-6, and CDKN2A in LX-2 cells with NQO1 knockdown. (E) Representative images of SA-β-GAL staining in LX-2 cells transfected with negative control (NC) and si-NQO1, along with corresponding statistical analysis of senescence-associated β-galactosidase activity. (F) Flow cytometry-based cell cycle analysis of LX-2 cells transfected with NC or si-NQO1, with statistical analysis of cell cycle distribution. All data are presented as mean ± SD. Statistical significance was determined using Student’s t-test. * p < 0.05, ** p < 0.01, *** p < 0.001, **** p < 0.0001.

Similar articles

References

    1. Devarbhavi H., Asrani S.K., Arab J.P., Nartey Y.A., Pose E., Kamath P.S. Global burden of liver disease: 2023 update. J. Hepatol. 2023;79:516–537. doi: 10.1016/j.jhep.2023.03.017. - DOI - PubMed
    1. Kisseleva T., Brenner D. Molecular and cellular mechanisms of liver fibrosis and its regression. Nat. Rev. Gastroenterol. Hepatol. 2021;18:151–166. doi: 10.1038/s41575-020-00372-7. - DOI - PubMed
    1. Higashi T., Friedman S.L., Hoshida Y. Hepatic stellate cells as key target in liver fibrosis. Adv. Drug Deliv. Rev. 2017;121:27–42. doi: 10.1016/j.addr.2017.05.007. - DOI - PMC - PubMed
    1. Sanfeliu-Redondo D., Gibert-Ramos A., Gracia-Sancho J. Cell senescence in liver diseases: Pathological mechanism and theranostic opportunity. Nat. Rev. Gastroenterol. Hepatol. 2024;21:477–492. doi: 10.1038/s41575-024-00913-4. - DOI - PubMed
    1. López-Otín C., Pietrocola F., Roiz-Valle D., Galluzzi L., Kroemer G. Meta-hallmarks of aging and cancer. Cell Metab. 2023;35:12–35. doi: 10.1016/j.cmet.2022.11.001. - DOI - PubMed

LinkOut - more resources