. 2025 Apr 30;14(5):545.
doi: 10.3390/antiox14050545.

The Effects of Lipid Extracts from Microalgae Chlorococcum amblystomatis and Nannochloropsis oceanica on the Proteome of 3D-Cultured Fibroblasts Exposed to UVA Radiation

Affiliations

The Effects of Lipid Extracts from Microalgae Chlorococcum amblystomatis and Nannochloropsis oceanica on the Proteome of 3D-Cultured Fibroblasts Exposed to UVA Radiation

Sinemyiz Atalay Ekiner et al. Antioxidants (Basel). .

Abstract

Nannochloropsis oceanica and Chlorococcum amblystomatis exhibit significant potential for protecting skin cells from oxidative stress-induced metabolic dysfunctions, owing to their high bioactive lipid content. This study aimed to evaluate their cytoprotective effects on the ultraviolet A (UVA)-perturbed proteome of 3D-cultured skin fibroblasts, using high-throughput proteomics. Chlorococcum amblystomatis lipid extract promoted a reduction in UVA-induced cytochrome c oxidase subunit 4 isoform 1 and cell death protein 6 levels, alongside the restoration of ferritin light chain expression diminished by UVA. It downregulated the expression of ubiquitin-conjugating enzyme E2 and lactoylglutathione lyase, which were upregulated by UVA. Furthermore, the elevated superoxide dismutase [Mn] mitochondrial levels in the caspase-1 interactome emphasized the lipid extract's role in mitigating oxidative stress-associated chronic inflammation by regulating caspase-1 activity. In addition to this notable redox balance-regulating and cytoprotective activity, conversely, the protein inflammation signaling mediated by UVA was regulated in terms of wound healing potential in the case of Nannochloropsis oceanica lipid extract. Following UVA radiation, it promoted the upregulation of complement component B, thrombospondin-1, MMP1, and fibulin-1. The results revealed that both lipid extracts effectively reversed the UVA-perturbed proteomic profile of fibroblasts, highlighting their therapeutic potential in protecting the skin from UV radiation.

Keywords: UVA radiation; freshwater microalgae Chlorococcum amblystomatis; human skin fibroblast; marine microalgae Nannochloropsis oceanica; proteomics; redox balance; wound healing.


Conflict of interest statement

The authors declare no conflicts of interest.

Figures

Figure 1
Figure 1
Principal component analysis of the fibroblast proteome from experimental cell groups treated with N. oceanica or C. amblystomatis lipid extracts. The analysis was conducted for the complete proteomic dataset (A,B) and the IP (hCasp1)-adjusted proteomic dataset (C,D) [CTR, control cells cultured in the 3D system with standard medium; N.o., the cells treated with lipid extract obtained from N. oceanica (3 µg/mL) for 24 h; C.a., the cells treated with lipid extract obtained from C. amblystomatis (3 µg/mL) for 24 h; UVA, the cells exposed to UVA (365 nm) at a dose of 13 J/cm3 and incubated in the 3D system with the standard growing medium for 24 h; UVA + N.o., the cells exposed to UVA (365 nm) at a dose of 13 J/cm3 and then incubated in the 3D system with the standard growing medium containing lipid extracts from N. oceanica (3 µg/mL) for 24 h; UVA + C.a., the cells exposed to UVA (365 nm) at a dose of 13 J/cm3 and then incubated in the 3D system with the standard growing medium containing lipid extracts from C. amblystomatis (3 µg/mL) for 24 h; IP (against hCasp1), immunoprecipitation against human caspase−1; PC1/2, principal component 1/2].
Figure 2
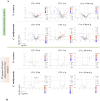
Figure 2
Volcano plots showing the effects of N. oceanica and C. amblystomatis lipid extracts on the proteome of fibroblasts in 3D-cultured experimental cell groups. The plots compare differential protein expression within the complete proteomic analysis (A) and the IP (hCasp1)-adjusted proteomic analysis (B) (CTR, control cells cultured in the 3D system with standard medium; N.o., the cells treated with lipid extract obtained from N. oceanica (3 µg/mL) for 24 h; C.a., the cells treated with lipid extract obtained from C. amblystomatis (3 µg/mL) for 24 h; UVA, the cells exposed to UVA (365 nm) at a dose of 13 J/cm3 and incubated in the 3D system with the standard growing medium for 24 h; UVA + N.o., the cells exposed to UVA (365 nm) at a dose of 13 J/cm3 and then incubated in the 3D system with the standard growing medium containing lipid extracts from N. oceanica (3 µg/mL) for 24 h; UVA + C.a., the cells exposed to UVA (365 nm) at a dose of 13 J/cm3 and then incubated in the 3D system with the standard growing medium containing lipid extracts from C. amblystomatis (3 µg/mL) for 24 h; IP (against hCasp1), immunoprecipitation against human caspase-1; significant features highlighted as blue and red as seen in figure-fold change had p < 0.05).
Figure 3
Figure 3
Heatmap of the top 25 proteins with significantly altered expression in fibroblasts derived from experimental cell groups treated with N. oceanica or C. amblystomatis lipid extracts (A,B) within the complete proteomic analysis. The hierarchical clustering demonstrates distinct proteomic profiles across treatment conditions (CTR, control cells cultured in the 3D system with standard medium; N.o., the cells treated with lipid extract obtained from N. oceanica (3 µg/mL) for 24 h; C.a., the cells treated with lipid extract obtained from C. amblystomatis (3 µg/mL) for 24 h; UVA, the cells exposed to UVA (365 nm) at a dose of 13 J/cm3 and incubated in the 3D system with the standard growing medium for 24 h; UVA + N.o., the cells exposed to UVA (365 nm) at a dose of 13 J/cm3 and then incubated in the 3D system with the standard growing medium containing lipid extracts from N. oceanica (3 µg/mL) for 24 h; UVA + C.a., the cells exposed to UVA (365 nm) at a dose of 13 J/cm3 and then incubated in the 3D system with the standard growing medium containing lipid extracts from C. amblystomatis (3 µg/mL) for 24 h). Proteins written in bold type characters present the proteins that are critical in regulating the dynamic oxidative stress and related inflammatory response as well as cell survival. Turning to the case of C. amblystomatis lipid extract within the complete proteomic analysis, the expression of lactoylglutathione lyase (Q04760) was found to be nearly 4-fold increased by UVA exposure but was significantly reduced following treatment with the C. amblystomatis lipid extract. Similarly, the UVA-induced upregulation of ubiquitin-conjugating enzyme E2 variant 1 (Q13404) was also significantly reduced by C. amblystomatis lipid extract treatment (approximately 0.7-fold change). On the other hand, the expression of prostaglandin E synthase 3 (Q15185) was moderately increased by UVA exposure (1.16-fold) and was further elevated slightly by C. amblystomatis lipid extract treatment (1.01-fold change). Additionally, the increase in eukaryotic translation initiation factor 5A-1 (P63241) expression caused by UVA exposure was significantly decreased following C. amblystomatis lipid extract treatment (0.7-fold change). Although this trend was also observed with N. oceanica lipid extract, the effect of N. oceanica was milder compared to C. amblystomatis. Furthermore, UVA exposure caused a dramatic decrease in cathepsin B (P07858) levels (0.8-fold), but C. amblystomatis lipid extract treatment mitigated this decline (0.05-fold change).
Figure 4
Figure 4
Changes in the average intensity levels of proteins involved in the regulation of wound healing (N. oceanica) or redox balance (C. amblystomatis) with significantly altered expression in fibroblasts derived from experimental cell groups (CTR, control cells cultured in the 3D system with standard medium; N.o., the cells treated with lipid extract obtained from N. oceanica (3 µg/mL) for 24 h; C.a., the cells treated with lipid extract obtained from C. amblystomatis (3 µg/mL) for 24 h; UVA, the cells exposed to UVA (365 nm) at a dose of 13 J/cm3 and incubated in the 3D system with the standard growing medium for 24 h; UVA + N.o., the cells exposed to UVA (365 nm) at a dose of 13 J/cm3 and then incubated in the 3D system with the standard growing medium containing lipid extracts from N. oceanica (3 µg/mL) for 24 h; UVA + C.a., the cells exposed to UVA (365 nm) at a dose of 13 J/cm3 and then incubated in the 3D system with the standard growing medium containing lipid extracts from C. amblystomatis (3 µg/mL) for 24 h). Mean values ± SD of three independent samples and statistically significant differences for p ≤ 0.05 are presented: (X) is used for differences vs. CTR; (Y) is used for differences between the group UVA and UVA + N.o. or UVA + C.a.
Figure 5
Figure 5
GO enrichment analysis. Pie charts displaying enriched GO terms were created using data from the PANTHER classification system, based on their fold enrichment, within the complete proteomic analysis in the case of N. oceanica or C. amblystomatis treatment of fibroblasts. Unique identifier codes assigned to specific GO terms expressing biological processes are given in parentheses. Only the proteins with statistically significant expression changes between experimental cell groups (due to the one-way ANOVA analysis) were included in the analysis.
Figure 6
Figure 6
Changes in the average intensity levels of proteins with significantly altered expression in fibroblasts derived from experimental cell groups (CTR, control cells cultured in the 3D system with standard medium; N.o., the cells treated with lipid extract obtained from N. oceanica (3 µg/mL) for 24 h; C.a., the cells treated with lipid extract obtained from C. amblystomatis (3 µg/mL) for 24 h; UVA, the cells exposed to UVA (365 nm) at a dose of 13 J/cm3 and incubated in the 3D system with the standard growing medium for 24 h; UVA + N.o., the cells exposed to UVA (365 nm) at a dose of 13 J/cm3 and then incubated in the 3D system with the standard growing medium containing lipid extracts from N. oceanica (3 µg/mL) for 24 h; UVA + C.a., the cells exposed to UVA (365 nm) at a dose of 13 J/cm3 and then incubated in the 3D system with the standard growing medium containing lipid extracts from C. amblystomatis (3 µg/mL) for 24 h) within IP(against hCasp1)-adjusted proteomic analysis. Mean values ± SD of three independent samples and statistically significant differences for p ≤ 0.05 are presented: (X) is used for differences vs. CTR; (Y) is used for differences between the group UVA and UVA + N.o. or UVA + C.a. [IP (against hCasp1), immunoprecipitation against human caspase-1].
Figure 7
Figure 7
Western blot analysis against β-actin, cytochrome C, ferritin light chain, RAS, peroxiredoxin 5, heat shock 10 kDa protein 1, matrix metalloproteinases 1 or fibulin 1 in the case of N. oceanica (A) or C. amblystomatis (B) lipid extract treatment of fibroblasts [CTR group, control fibroblasts cultured in 3D system with standard medium; N.o. group, the fibroblasts treated with lipid extract obtained from N. oceanica (3 µg/mL) for 24 h; C.a. group, the fibroblasts treated with lipid extract obtained from C. amblystomatis (3 µg/mL) for 24 h; UVA group, the fibroblasts exposed to UVA (365 nm) at a dose of 13 J/cm3 and incubated in 3D system with the standard growing medium for 24 h; UVA + N.o. group, the fibroblasts exposed to UVA (365 nm) at a dose of 13 J/cm3 and then incubated in 3D system with the standard growing medium containing lipid extracts from N. oceanica (3 µg/mL) for 24 h; UVA + C.a. group, the fibroblasts exposed to UVA (365 nm) at a dose of 13 J/cm3 and then incubated in 3D system with the standard growing medium containing lipid extracts from C. amblystomatis (3 µg/mL) for 24 h]. The relevant protein band has been shown with a black arrow. All the original photos of the membranes are presented in Supplementary Figure S2.
Figure 8
Figure 8
Assessment of cellular antioxidant response and oxidative stress. The level of phosphorylated-Nrf2 (pNrf2, active), heme oxygenase-1 (HO-1) and 4-HNE (lipid peroxidation product, oxidative stress marker) were determinated in fibroblasts [CTR group, control fibroblasts cultured in 3D system with standard medium; N.o. group, the fibroblasts treated with lipid extract obtained from N. oceanica (3 µg/mL) for 24 h; C.a. group, the fibroblasts treated with lipid extract obtained from C. amblystomatis (3 µg/mL) for 24 h; UVA group, the fibroblasts exposed to UVA (365 nm) at a dose of 13 J/cm3 and incubated in 3D system with the standard growing medium for 24 h; UVA + N.o. group, the fibroblasts exposed to UVA (365 nm) at a dose of 13 J/cm3 and then incubated in 3D system with the standard growing medium containing lipid extracts from N. oceanica (3 µg/mL) for 24 h; UVA + C.a. group, the fibroblasts exposed to UVA (365 nm) at a dose of 13 J/cm3 and then incubated in 3D system with the standard growing medium containing lipid extracts from C. amblystomatis (3 µg/mL) for 24 h]. The levels of pNrf2 and HO-1 (ng/mg protein) were expressed as a percentage of the expression observed in the control cells (as explained in Section 2.6.2) and obtained 4-HNE values were expressed as nmol/mg protein (as explained in Section 2.7). Mean values ± SD of three independent samples and statistically significant differences for p ≤ 0.05 are presented: (a) is used for differences vs. CTR; (b) is used for differences between N.o. group and C.a. group; (x) is used for differences between UVA group and UVA + N.o. group/UVA + C.a. group; (y) is used for differences between UVA + N.o. group and UVA + C.a. group.
Figure 9
Figure 9
Scratch wound healing of skin fibroblasts treated with N. oceanica or C. amblystomatis lipid extracts (3 µg/mL) following exposure to UVA (365 nm) at a dose of 13 J/cm3.
Figure 10
Figure 10
A summary illustration of the wound healing potential of N. oceanica lipid extract and the redox balance and cell survival regulatory actions of C. amblystomatis lipid extract. The figure highlights alterations in protein expression and their impact on associated intracellular molecular signaling pathways. [An upward arrow signifies an increase, while a downward arrow indicates a decrease in protein expression, within orange color (showing UVA effect) or blue/green color (showing the effect of treatment with N. oceanica or C. amblystomatis lipid extracts following UVA radiation). Light blue/green colors are used to express the slowing down effect. The dash symbol is used to represent no protein identification.].

Similar articles

References

    1. Wei M., He X., Liu N., Deng H. Role of reactive oxygen species in ultraviolet-induced photodamage of the skin. Cell Div. 2024;19:1. doi: 10.1186/s13008-024-00107-z. - DOI - PMC - PubMed
    1. de Jager T.L., Cockrell A.E., Du Plessis S.S. Ultraviolet Light Induced Generation of Reactive Oxygen Species. Adv. Exp. Med. Biol. 2017;996:15–23. doi: 10.1007/978-3-319-56017-5_2. - DOI - PubMed
    1. Hunt M., Torres M., Bachar-Wikstrom E., Wikstrom J.D. Cellular and molecular roles of reactive oxygen species in wound healing. Commun. Biol. 2024;7:1534. doi: 10.1038/s42003-024-07219-w. - DOI - PMC - PubMed
    1. Wang G., Yang F., Zhou W., Xiao N., Luo M., Tang Z. The initiation of oxidative stress and therapeutic strategies in wound healing. Biomed. Pharmacother. 2023;157:114004. doi: 10.1016/j.biopha.2022.114004. - DOI - PubMed
    1. Jakovija A., Chtanova T. Skin immunity in wound healing and cancer. Front. Immunol. 2023;14:1060258. doi: 10.3389/fimmu.2023.1060258. - DOI - PMC - PubMed

LinkOut - more resources