. 2025 May 21;15(5):746.
doi: 10.3390/biom15050746.

Multiomics-Based Profiling of the Fecal Microbiome Reveals Potential Disease-Specific Signatures in Pediatric IBD (PIBD)

Affiliations

Multiomics-Based Profiling of the Fecal Microbiome Reveals Potential Disease-Specific Signatures in Pediatric IBD (PIBD)

Anita H DeSantis et al. Biomolecules. .

Abstract

Inflammatory bowel disease (IBD), which includes Crohn's Disease (CD) and Ulcerative Colitis (UC), is a chronic gastrointestinal (GI) disorder affecting 1 in 100 people in the United States. Pediatric IBD (PIBD) is estimated to impact 15 per 100,000 children in North America. Factors such as the gut microbiome (GM), genetic predisposition to the disease, and certain environmental factors are thought to be involved in pathogenesis. However, the pathophysiology of IBD is incompletely understood, and diagnostic biomarkers and effective treatments, particularly for PIBD, are limited. Recent work suggests that these factors may interact to influence disease development, and multiomic approaches have emerged as promising tools to elucidate the pathophysiology. We employed metagenomics, metabolomics- and metatranscriptomics-based approaches to examine the microbiome, its genetic potential, and its activity to identify factors associated with PIBD. Metagenomics-based analyses revealed pathways such as octane oxidation and glycolysis that were differentially expressed in UC patients. Additionally, metatranscriptomics-based analyses suggested enrichment of glycan degradation and two component systems in UC samples as well as protein processing in the endoplasmic reticulum, ribosome, and protein export in CD and UC samples. In addition, metabolomics-based approaches revealed patterns of differentially abundant metabolites between healthy and PIBD individuals. Interestingly, overall microbiome community composition (as measured by alpha and beta diversity indices) did not appear to be associated with PIBD. However, we observed a small number of differentially abundant taxa in UC versus healthy controls, including members of the Classes Gammaproteobacteria and Clostridia as well as members of the Family Rikenellaceae. Accordingly, when identifying potential biomarkers for PIBD, our results suggest that multiomics-based approaches afford enhanced potential to detect putative biomarkers for PIBD compared to microbiome community composition sequence data alone.

Keywords: Crohn’s Disease; Ulcerative Colitis; biomarkers; inflammatory bowel disease; metabolomics; metagenomics; metatranscriptomics; microbiome; multiomics; pediatric inflammatory bowel disease.


Conflict of interest statement

The authors declare no conflicts of interest. The funders had no role in the design of the study; in the collection, analyses, or interpretation of data; in the writing of the manuscript; or in the decision to publish the results.

Figures
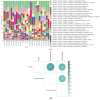
Figure 1
Figure 1
(A) Overall microbiome composition did not vary as a function of disease state based on relative frequency of taxonomic classification. The species-level taxonomic assignments from 16S sequencing were matched with the Greengenes database. (B) CD, UC, and healthy samples appear similar; however, CD and healthy samples seem slightly more similar to one another than to UC samples based on the correlation plot showing Jaccard dissimilarity indices between groups by diagnosis. The darker and larger circles correspond to higher levels of dissimilarity. (C) Beta diversity dissimilarities are comparable between CD, UC, and healthy samples, but CD and healthy samples are more similar to one another than to UC samples. Box plots show all Jaccard dissimilarity index values between groups based on the presence and absence of species-level taxa from 16S sequencing. The dissimilarities between each pair of groups are represented by the distributions on the box-plot, and the distributions of each comparison are then compared to each other using a Wilcox test.
Figure 1
Figure 1
(A) Overall microbiome composition did not vary as a function of disease state based on relative frequency of taxonomic classification. The species-level taxonomic assignments from 16S sequencing were matched with the Greengenes database. (B) CD, UC, and healthy samples appear similar; however, CD and healthy samples seem slightly more similar to one another than to UC samples based on the correlation plot showing Jaccard dissimilarity indices between groups by diagnosis. The darker and larger circles correspond to higher levels of dissimilarity. (C) Beta diversity dissimilarities are comparable between CD, UC, and healthy samples, but CD and healthy samples are more similar to one another than to UC samples. Box plots show all Jaccard dissimilarity index values between groups based on the presence and absence of species-level taxa from 16S sequencing. The dissimilarities between each pair of groups are represented by the distributions on the box-plot, and the distributions of each comparison are then compared to each other using a Wilcox test.
Figure 2
Figure 2
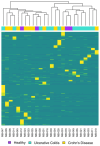
No significant clustering of samples was found in the microbiome composition between the study groups using whole genome sequencing data. The heatmap shows the relative abundance of taxonomic species identified using Metaphlan. The top dendrogram shows the clustering of samples, with each sample color-coded according to diagnosis. In the figure, yellow indicates species with higher abundance, transitioning to blue for species with lower abundance.
Figure 3
Figure 3
Fermentation superpathway and acetylene degradation pathway appear enriched in CD and UC versus healthy controls based on the comparison of the genomic potential of functional pathways using assembly-free analysis for all CD and all UC vs. healthy.
Figure 4
Figure 4
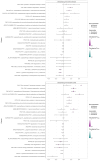
Protein synthesis pathways—RNA polymerase, protein processing, and ribosomes—and sugar metabolism pathway—glycan degradation— appear enriched in diseased groups compared to healthy controls according to the Dotplots for pairwise group comparisons with Kegg functional pathways. The X-axis shows the ratio of differentially expressed genes that are annotated with each KEGG term (different GeneRatio values do not add up to 1.0 because genes are often annotated with multiple KEGG terms). The color of the dot represents the adjusted p-value with the color scale in the legends for each plot. The size of the dot represents the number of differentially expressed genes associated with that term.
Figure 5
Figure 5
The metabolomes of healthy and PIBD samples tended to group together when visualized via Principal Component Analysis (PCA). CD patients appear to cluster closer to healthy controls than UC patients as demonstrated by the overlapping circles. Groups were analyzed using PERMANOVA, and distributions were computed by using the Euclidean distance based on the PCs in MetaboAnalyst 6.0 software. Respective group colorings denote 95% confidence intervals.
Figure 6
Figure 6
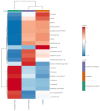
The fecal metabolomes of UC patients exhibit distinct clustering patterns from CD and healthy controls in a Pearson Ward heatmap of metabolite abundance across consolidated diagnoses. Rows represent individual metabolites while columns correspond to consolidated diagnoses. The color scale indicates relative abundance with red representing higher concentrations of a given metabolite while blue indicates lower concentrations.
Figure 7
Figure 7
Abundance of several metabolites varies according to disease state: (A) choline, (B) DL-tryptophan, (C) HIAA, (D) Beta-D-Mannopyranose (E) L-tyrosine, (F) L-valine (G) Platelet-activating factor. Boxplots of 6 metabolites show significant differences between the consolidated diagnoses and healthy controls.
Figure 8
Figure 8
Pathway enrichment analysis of Ulcerative Colitis and Crohn’s Disease samples show significant differences in vital microbial metabolic pathways. Data are plotted as −log10(p) versus pathway impact and darker color represent greater significant differences. Larger circle sizes represent a greater pathway impact and darker shades of red represent greater significance.

References

    1. Sýkora J., Pomahačová R., Kreslová M., Cvalínová D., Štych P., Schwarz J. Current global trends in the incidence of pediatric-onset inflammatory bowel disease. World J. Gastroenterol. 2018;24:2741–2763. doi: 10.3748/wjg.v24.i25.2741. - DOI - PMC - PubMed
    1. Bouhuys M., Lexmond W.S., Van Rheenen P.F. Pediatric Inflammatory Bowel Disease. Pediatrics. 2023;151:e2022058037. doi: 10.1542/peds.2022-058037. - DOI - PubMed
    1. Wiczynska-Ryl J., Krogulska A. Incidence of Inflammatory Bowel Disease in Children. Gastroenterol. Res. 2025;18:71–84. doi: 10.14740/gr2007. - DOI - PMC - PubMed
    1. Tartamus G.V., Serban D.E., Fogas C.R., Tantau M.V. Pediatric Inflammatory Bowel Disease in Romania: The First Epidemiological Study of the North-West Region (2000–2020) Children. 2025;12:403. doi: 10.3390/children12040403. - DOI - PMC - PubMed
    1. Conrad M.A., Rosh J.R. Pediatric Inflammatory Bowel Disease. Pediatr. Clin. 2017;64:577–591. doi: 10.1016/j.pcl.2017.01.005. - DOI - PubMed

MeSH terms

LinkOut - more resources