Review
. 2025 May 20;12(5):547.
doi: 10.3390/bioengineering12050547.

Recycled Sericin Biopolymer in Biotechnology and Bioelectronics

Affiliations
Review

Recycled Sericin Biopolymer in Biotechnology and Bioelectronics

Davide Vurro et al. Bioengineering (Basel). .

Abstract

In a world characterized by rapid industrialization and a growing population, plastic or polymeric waste handling has undergone significant transformations. Recycling has become a major strategy where silk sericin has great potential among recyclable polymers. This naturally occurring biopolymer is a sustainable and versatile material with a wide range of potential uses in biotechnology and sensing. Furthermore, preparing and studying new environmentally friendly functional polymers with attractive physicochemical properties can open new opportunities for developing next-generation materials and composites. Herein, we provide an overview of the advances in the research studies of silk sericin as a functional and eco-friendly material, considering its biocompatibility and unique physicochemical properties. The structure of silk sericin and the extraction procedures, considering the influence of preparation methods on its properties, are described. Sericin's intrinsic properties, including its ability to crosslink with other polymers, its antioxidative capacity, and its biocompatibility, render it a versatile material for multifunctional applications across diverse fields. In biotechnology, the ability to blend sericin with other polymers enables the preparation of materials with varied morphologies, such as films and scaffolds, exhibiting enhanced mechanical strength and anti-inflammatory effects. This combination proves particularly advantageous in tissue engineering and wound healing. Furthermore, the augmentation of mechanical strength, coupled with the incorporation of plasticizers, makes sericin films suitable for the development of epidermal electrodes. Simultaneously, by precisely controlling hydration and permeability, the same material can be tailored for applications in packaging and the food industry. This work highlights the multidisciplinary and multifunctional nature of sericin, emphasizing its broad applicability.

Keywords: bioelectronics; biopolymers; biosensors; biotechnology; green chemistry; silk sericin; sustainability; tissue engineering.


Conflict of interest statement

The authors declare no conflicts of interest.

Figures

Figure 1
Figure 1
Graphic representation of the hierarchical and chemical structure of silk fiber. Silk is a continuous strand of two SF filaments (shown in blue), coated with an external Ser layer (shown in yellow), which serves as a binder to hold together the SF fibers composing the silk thread. Magnification highlights the intermolecular hydrogen bonding between the silk SF and Ser.
Figure 2
Figure 2
Summary of Ser applications in the biotechnology and bioelectronics fields.
Figure 3
Figure 3
(a) Images showing the flexible temperature sensor formed from silk proteins. The sensor may be placed on skin or integrated into a wrinkled surface (e.g., a textile) with a small form factor. (b) SEM imaging of the cross-section of the sensor shows the layers that are covalently integrated, preventing delamination and improving stability. (c) The calibration curve shows the temperature response of the flexible sensors. The inset shows the signal vs. time measured by chronoamperometry in steps of 5 °C. (n = 3 different sensing experiments). Reprinted with permission from [132]. Copyright 2021 American Chemical Society. (d) Schematic of electrode positioning on body. (e) Typical ECG waveforms acquired using an SS/PVACaCl2 electrode. (f) QRS duration as a function of time monitoring of SS/PVA/CaCl2 20 wt% (dotted lines indicate the threshold clinical value of QRS duration for healthy people, i.e., 0.12 s). Adapted with permission from [112]. Copyright 2025 American Chemical Society.
Figure 4
Figure 4
(a) Protein-based nanocarrier: schematic diagram of a nanoparticle composed of proteins. The proteins are depicted as folded chains forming a core, with bonds highlighting the β-sheet structure. (b) Properties of protein nanocarriers. (c) Illustration of major drug delivery routes with advantages, disadvantages, and schematic approach. Oral: Ser degradation by various proteases into peptides leads to the opening of capsules, releasing the drug, which is then absorbed. Intravenous: drug in aqueous solution is released directly into the bloodstream. Transdermal: steady and gradual release of the drug through the epidermis. Inhalation: capsules with reduced diameter can reach the deeper lung regions, enhancing system efficiency.
Figure 5
Figure 5
(a) Synthesis of Ser/dextran conjugate. (b) SEM image of microparticles at the concentration of 5%. (c) SEM image of microparticles at the concentration of 10%. (d) DLS size distribution of microparticles at the concentration of 5%. (e) DLS size distribution of microparticles at the concentration of 10%. (f) Native atazanavir dissolution profile. (g) Atazanavir-loaded SDC microparticles; inserted image was the linear regression lines (a, pH 2.0; b, pH 6.5; c, pH 7.4; d, pH 8.0) [151].
Figure 6
Figure 6
(a) Aldehyde content and molecular weight of dextran and derivatives. (b) Time evolution of storage modulus (G′) and loss modulus (G″) of SDH-1, SDH-2, and SDH-3 at 15 °C. (c) Scanning electron micrographs of SDH-1 (left), SDH-2 (middle), and SDH-3 (right). Scale bars, 10 μm. (d) Photoluminescent properties for monitoring hydrogel degradation and drug release in vivo. In vivo fluorescence imaging of C57BL/6 mice subcutaneously injected with SDH-1, SDH-2, and SDH-3 (white arrows) 2 h after injection. (e) Quantification of in vivo weight loss and fluorescence intensity reduction of the composite hydrogel (SDH-2) over 70 days. (f) Correlation of fluorescence intensity and weight of the SDH-2 hydrogel during in vivo degradation. (g) SDH-2 (upper panel) loaded with DOX (middle panel) was injected subcutaneously and degraded over 17 days, monitored by a small animal imaging device using the green fluorescence of SDH-2 (excitation wavelength 420 nm; emission wavelength 530 nm). DOX was observed by its red fluorescence (excitation wavelength 430 nm; emission wavelength 600 nm). The merged images of SDH-2 and DOX are shown in the lower panel. The images outlined by white dotted lines in the upper right corner are enlargements of the merged images. (h,i) Quantification of fluorescence intensity reduction in (h) SDH hydrogels and DOX in vivo at (i) the SDH hydrogel sites over 17 days (n = 3 per group per time point; * p < 0.05, ** p < 0.01; and student’s t-tests). (jl) Correlation of the fluorescence intensity of DOX with the fluorescence intensity of the (j) SDH-1, (k) SDH-2, and (l) SDH-3 hydrogels during in vivo degradation. (mo) In vivo antitumor activities of the DOX-loaded SDH-2 hydrogel. Quantification of (m) tumor size, (n) body weight, and (o) the survival rate in B16–F10-bearing mice receiving PBS, SDH-2, free DOX (DOX), and the DOX-loaded SDH-2 hydrogel (SDH-2 + DOX) [n = 7–12 per group per time point; * p < 0.05 (DOX-loaded SDH-2 relative to free DOX); and student’s t-tests]. (p) Representative image of the isolated tumors on day 14 from the mice receiving the indicated treatments. Adapted with permission from [155], Copyright 2016 American Chemical Society.
Figure 7
Figure 7
(a) The level of cytosol detoxification enzyme and urea cycle enzyme genes in HepG2 cells among treatments. Bar graphs indicated the mRNA fold change expression of CYP1A2 (A), ALDH-2 (B), CPS-1 (C), and OTC (D) genes in HepG2-treated with or without simvastatin and two doses of Ser. *; p ≤ 0.05, **; p ≤ 0.01, ***; p ≤ 0.001, ****; p ≤ 0.0001. (b) CARD-9, MAPK, and LC-3 immunolabelling in the liver mitochondria from the rat among treatments. Electron micrographs show immunogold labelling of CARD-9, MAPK, and LC-3 expressions (arrow) in liver mitochondria extracted from rats without (A,E,I) or with simvastatin (B,F,J) and Ser (C,G,K) treatments. The expression of these markers was located on mitochondrial cristae, matrix, and membrane [161]. (c) Effects of Ser on key protein expression of the hepatic insulin signaling pathway in mice. Quantitative analysis of IR, IRS, PI3K, and p-AKT protein expression (B) and quantitative analysis of LKB, GSK3b, GS, and GLUT4 protein expression (D). * p < 0.05, ** p < 0.01, and *** p < 0.001 versus normal group; # p < 0.05, ## p < 0.01, and ### p < 0.001 versus diabetic model group. (d) Effects of Ser on the expression of key proteins of glucose metabolism in mouse liver. Quantitative analysis of G6Pase, GLK, PCK, PFK1, and PKM2 protein expression. ** p < 0.01 and *** p < 0.001 versus normal group; ## p < 0.01 and ### p < 0.001 versus diabetic model group. (e) Effects of Ser on the expression of key proteins in lipid metabolism in mice. Quantitative analysis of AMPKa and ACC protein expression. * p < 0.05 and ** p < 0.01 versus normal group; # p < 0.05 versus diabetic model group. Reprinted from [162], Copyright 2020, with permission from Elsevier. (f) Schematic representation of hydrogel fabrications for myocardial infarctions [163].
Figure 8
Figure 8
(a) Percentage of crosslinks in Ser/PVA/glycerin scaffold with various concentrations of genipin from 0.01 to 0.1% compared with crosslink of the Ser/PVA and Ser/PVA/glycerin scaffolds, respectively. (□) indicates difference in percentage of crosslinks of Ser/PVA/glycerin + genipin with Ser/PVA/glycerin scaffold. (■) indicates the difference in percentage of crosslinks of Ser/PVA/glycerin plus genipin with Ser/PVA scaffold. * indicates significant differences at p < 0.05. Reprinted from [169], Copyright 2010, with permission from Elsevier. (b) The morphology of mouse myoblast cells (C2C12) growing on the polystyrene surface of the culture dishes (upper panel) and the Ser hydrogel (lower panel) at the different time points after seeding. The cells were initially seeded at the density of 5 × 10⁴ per 35 mm culture dish. Scale bars, 50 μm [156]. (c) The cryo-SEM morphology of the Alginate/Ser/GO hydrogel (A-F). Hydrogel implantation into the distal femoral defects and the subsequent micro-CT analysis. (d) The procedure of implanting hydrogels into the critical bone defect in rat femurs. The Alginate/Ser/GO hydrogel was injected into the defect with 1.65 wt% alginate, 2 wt% Ser, and 20 μg/mL GO. (e) Representative coronal and 3D reconstruction images of micro-CT in rat femurs after 1 to 8 weeks of implantation. Reprinted from [170], with Copyright 2021, with permission from Elsevier. (f) The representative images of the hydrogels under the light at the different wavelengths (left column, images are captured under the white light; middle column (red), images (excited at 538–546 nm) are collected using an optical filter with 590 nm; right column (green), images (excited at 480 nm) are collected using an optical filter with 530 nm). Scale bars, 500 mm. (g) The quantitative analysis of red and green fluorescence intensity from images. Reprinted from [159], with Copyright 2024, with permission from Elsevier.
Figure 9
Figure 9
(a) Preparation of Ser powder, BC pellicles, and BC/Ser composites. (c = [Ser] in % w/v, 1, 2, 3; A. xylinum = Acetobacter xylinum; HS = Hestrin and Schramm). Reprinted with permission from [180], Copyright © 2016, American Chemical Society. (b) Ser wound dressing promoted the healing of wounds in mice. Schematic illustration of the treatment procedure for mice acute. (c) Representative photographs of the wound closure process were captured in fifteen-day experiments. (d) Wound closure rates were evaluated after 3, 7, and 15 days, presented as the percentage of the initial wound area at day 0. (e) H&E staining of skin tissues on day 7 after wounding. Scale bar, 500 µm. The black dashed boxes indicate newly formed epithelium. Five mice per group per condition. Reprinted from [181], Copyright 2023, with permission from Elsevier.
Figure 10
Figure 10
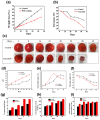
(a) Effect of Ser-based edible coating on weight loss. (b) Effect of Ser-based edible coating on the firmness for 45 days of storage at 25 °C. (c) Photos of the tomatoes with and without the Ser-based edible coating. (d) pH. (e) Total soluble sugars (TSSs). (f) Titratable acidity (TA). (g) Lycopene content. (h) Total phenolic content (TPC). (i) Total antioxidant concentration (TAC) was monitored in tomatoes coated with a Ser-based edible coating at 25 °C. For these experiments, fruits without coating served as control [193].

Similar articles

References

    1. Bandh S.A., Malla F.A., Wani S.A., Hoang A.T. Waste Management in the Circular Economy. Springer; Cham, Switzerland: 2024. Waste Management and Circular Economy; pp. 1–17.
    1. Chouhan D., Mandal B.B. Silk Biomaterials in Wound Healing and Skin Regeneration Therapeutics: From Bench to Bedside. Acta Biomater. 2020;103:24–51. doi: 10.1016/j.actbio.2019.11.050. - DOI - PubMed
    1. Fagnani D.E., Tami J.L., Copley G., Clemons M.N., Getzler Y.D.Y.L., McNeil A.J. 100th Anniversary of Macromolecular Science Viewpoint: Redefining Sustainable Polymers. ACS Macro Lett. 2021;10:41–53. doi: 10.1021/acsmacrolett.0c00789. - DOI - PubMed
    1. Shi L., Zhu L. Recent Advances and Challenges in Enzymatic Depolymerization and Recycling of PET Wastes. ChemBioChem. 2023;25:e202300578. doi: 10.1002/cbic.202300578. - DOI - PubMed
    1. Marques G.G., Couffin A., Hajji P., Inoubli R., Bounor-Legaré V., Fulchiron R. A Review on the Formulation and Rupture Properties of Polyethylene Terephthalate in a Mechanical Recycling Context. Ind. Eng. Chem. Res. 2023;63:887–920. doi: 10.1021/acs.iecr.3c02376. - DOI

LinkOut - more resources