

Comparative Analysis of Gut Microbiome Community Structures in Different Populations of Asian Elephants in China and Their Correlation with Diet
- PMID: 40428305
- PMCID: PMC12111563
- DOI: 10.3390/genes16050483
Comparative Analysis of Gut Microbiome Community Structures in Different Populations of Asian Elephants in China and Their Correlation with Diet
Abstract
Background: The interaction and co-evolution between the gut microbiome and the host play important roles in the host's physiology, nutrition, and health. Diet is considered an important driver of differences in the gut microbiota; however, research on the relationship between the gut microbiota and diet in Asian elephants remains limited.
Methods: In this study, we explored the gut microbiota structure and its relationship with diet in different populations of Asian elephants through metagenomic sequencing, combined with previously published dietary data.
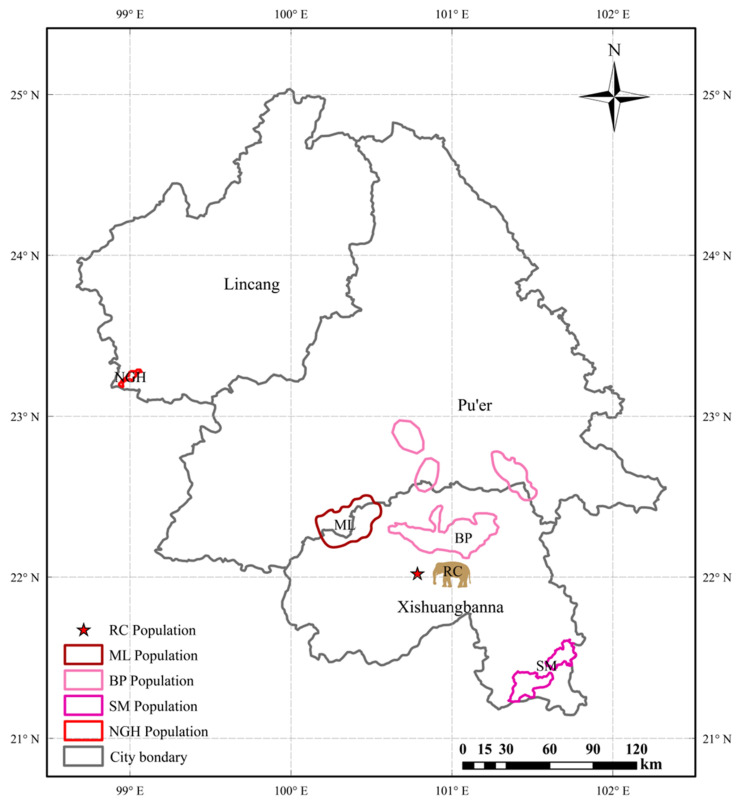
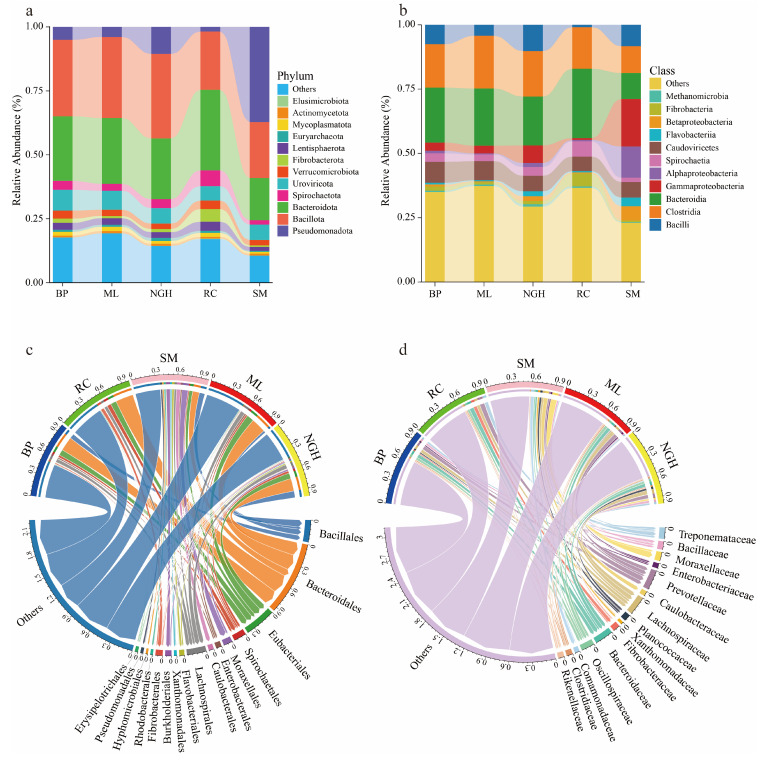
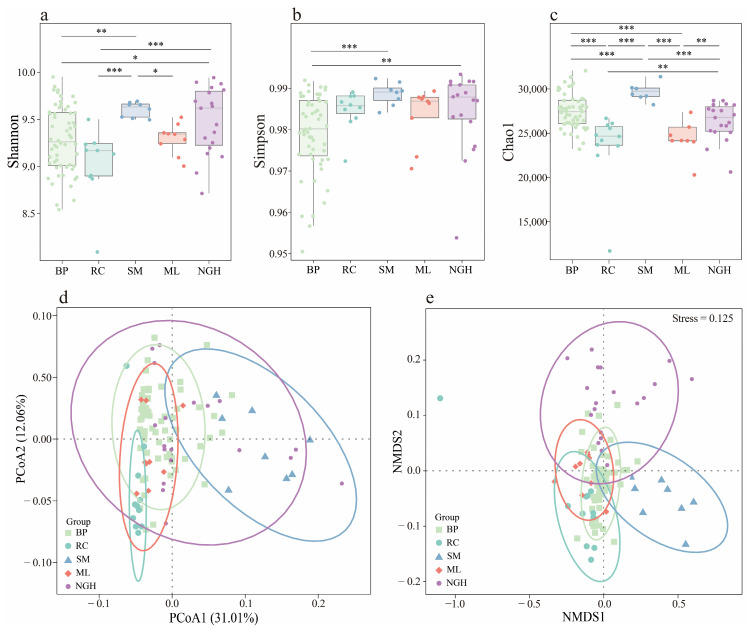
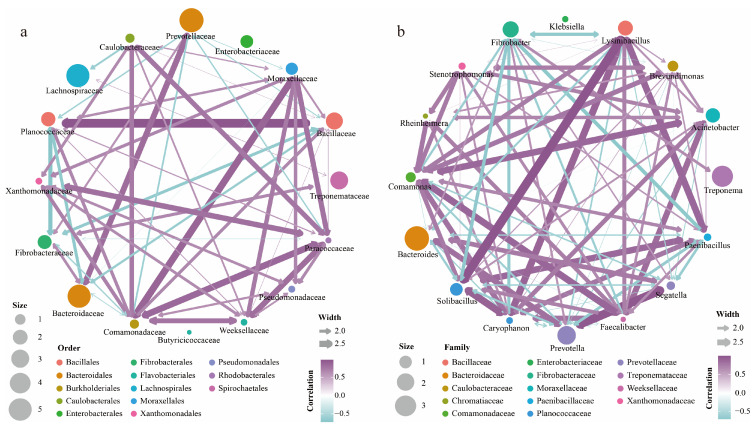
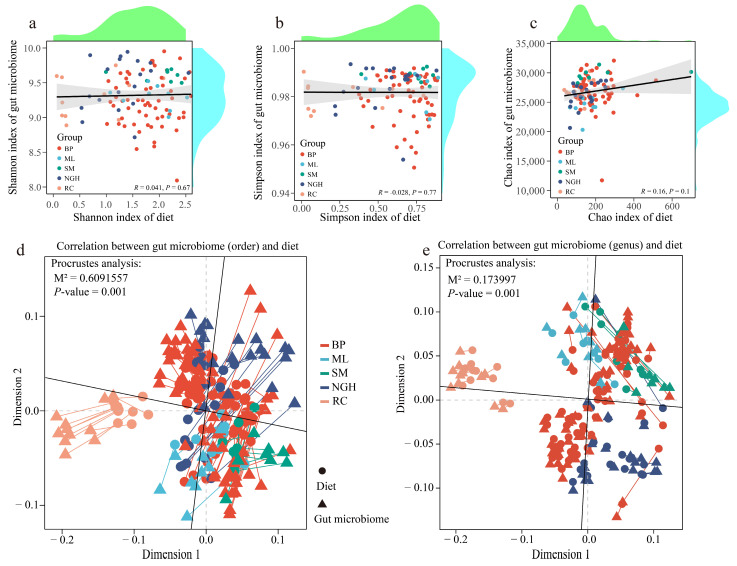
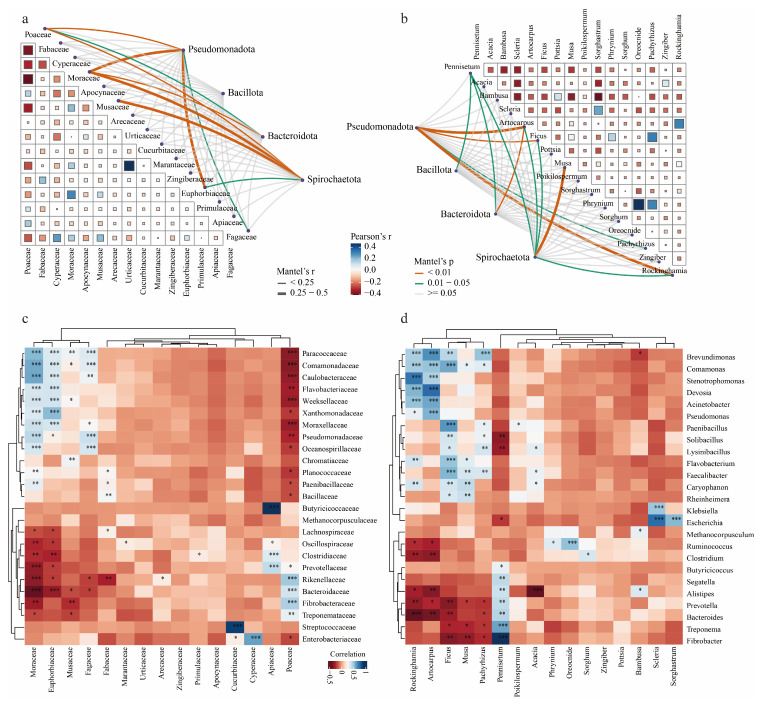
Results: This study found that the dominant gut microbiota of Asian elephants includes the phyla Bacillota (29.85% in BP, 22.79% in RC, 21.89% in SM, 31.67% in ML, and 33.00% in NGH), Bacteroidota (25.25% in BP, 31.44% in RC, 16.44% in SM, 25.73% in ML, and 23.74% in NGH), and Spirochaetota (3.49% in BP, 6.18% in RC, 1.71% in SM, 2.69% in ML, and 3.52% in NGH), with significant differences in the gut microbiota among different populations. Correlation analysis between the gut microbiota and diet revealed that dietary diversity did not directly affect the alpha diversity of the gut microbiota. However, specific food types might play a key role in shaping the gut microbiota structure by regulating the abundance of certain microbiota.
Conclusions: This study reveals significant differences in the gut microbiota structure among different populations of Asian elephants and explores the impact of diet on the structure. The results provide foundational data for a deeper understanding of the gut microbiota structure of Asian elephants and offer important references for the scientific conservation and precise management strategies of this species.
Keywords: Asian elephant; diet–gut microbiome interaction; gut microbiome; metagenomic sequencing; microbial diversity.
Conflict of interest statement
The authors declare no conflicts of interest.
Figures
Similar articles
-
Comparative and functional analyses of fecal microbiome in Asian elephants.Antonie Van Leeuwenhoek. 2022 Sep;115(9):1187-1202. doi: 10.1007/s10482-022-01757-1. Epub 2022 Jul 28. Antonie Van Leeuwenhoek. 2022. PMID: 35902439
-
Characteristics of gut microbiota profiles in Asian elephants (Elephas maximus) with gastrointestinal disorders.Sci Rep. 2025 Jan 8;15(1):1327. doi: 10.1038/s41598-025-85495-0. Sci Rep. 2025. PMID: 39779898 Free PMC article.
-
Gut microbiota diversity among humans, elephants, livestock and wild herbivores in Chitwan National Park bears implications for conservation medicine.Sci Rep. 2025 Apr 4;15(1):11596. doi: 10.1038/s41598-025-89402-5. Sci Rep. 2025. PMID: 40185849 Free PMC article.
-
Effect of diet on the evolution of gut commensal bacteria.Gut Microbes. 2024 Jan-Dec;16(1):2369337. doi: 10.1080/19490976.2024.2369337. Epub 2024 Jun 21. Gut Microbes. 2024. PMID: 38904092 Free PMC article. Review.
-
Diet-Gut Microbiota Relations: Critical Appraisal of Evidence From Studies Using Metagenomics.Nutr Rev. 2025 Jul 1;83(7):e1917-e1938. doi: 10.1093/nutrit/nuae192. Nutr Rev. 2025. PMID: 39718602 Free PMC article. Review.
References
-
- Peng X., Sun Y., Chen Y., Aliana N., Shi K. Diet Analysis of Asian Elephants Using Next-Generation Sequencing. J. Resour. Ecol. 2023;14:616–630. doi: 10.5814/j.issn.1674-764x.2023.03.016. - DOI
-
- Zhang H., Guo S., Ma L., Su K., Lobora A., Hou Y., Wen Y. Living with elephants: Analyzing commonalities and differences in human-elephant conflicts in China and Tanzania based on residents’ perspectives. Glob. Ecol. Conserv. 2024;53:e03034. doi: 10.1016/j.gecco.2024.e03034. - DOI
-
- Moustafa M.A.M., Chel H.M., Thu M.J., Bawm S., Htun L.L., Win M.M., Oo Z.M., Ohsawa N., Lahdenpera M., Mohamed W.M.A., et al. Anthropogenic interferences lead to gut microbiome dysbiosis in Asian elephants and may alter adaptation processes to surrounding environments. Sci. Rep. 2021;11:741. doi: 10.1038/s41598-020-80537-1. - DOI - PMC - PubMed
-
- Yu Q., Hu Z., Huang C., Xu T., Onditi K.O., Li X., Jiang X. Suitable habitats shifting toward human-dominated landscapes of Asian elephants in China. Biodivers. Conserv. 2023;33:685–704. doi: 10.1007/s10531-023-02766-w. - DOI
Publication types
MeSH terms
Grants and funding
LinkOut - more resources
Full Text Sources
