

Interaction Between Dietary Fiber Intake and MTNR1B rs10830963 Polymorphism on Glycemic Profiles in Young Brazilian Adults
- PMID: 40428319
- PMCID: PMC12110926
- DOI: 10.3390/genes16050497
Interaction Between Dietary Fiber Intake and MTNR1B rs10830963 Polymorphism on Glycemic Profiles in Young Brazilian Adults
Abstract
Background/objective: The single-nucleotide polymorphism (SNP) rs10830963 in the melatonin receptor 1B (MTNR1B) gene influences insulin secretion and glucose metabolism and has been associated with an increased risk of type-2 diabetes. This study aimed to explore the interaction between dietary intake and the MTNR1B rs10830963 polymorphism on glycemic profiles in young Brazilian adults.
Methods: This cross-sectional study assessed 200 healthy young adults (19-24 years), evaluating the MTNR1B rs10830963 genotype, anthropometric parameters, glycemic markers (fasting insulin, glucose, HOMA-IR, and HOMA-β), and dietary intake via three 24 h dietary recalls. Genotype-diet interactions were tested using multivariate linear regression models adjusted for confounders.
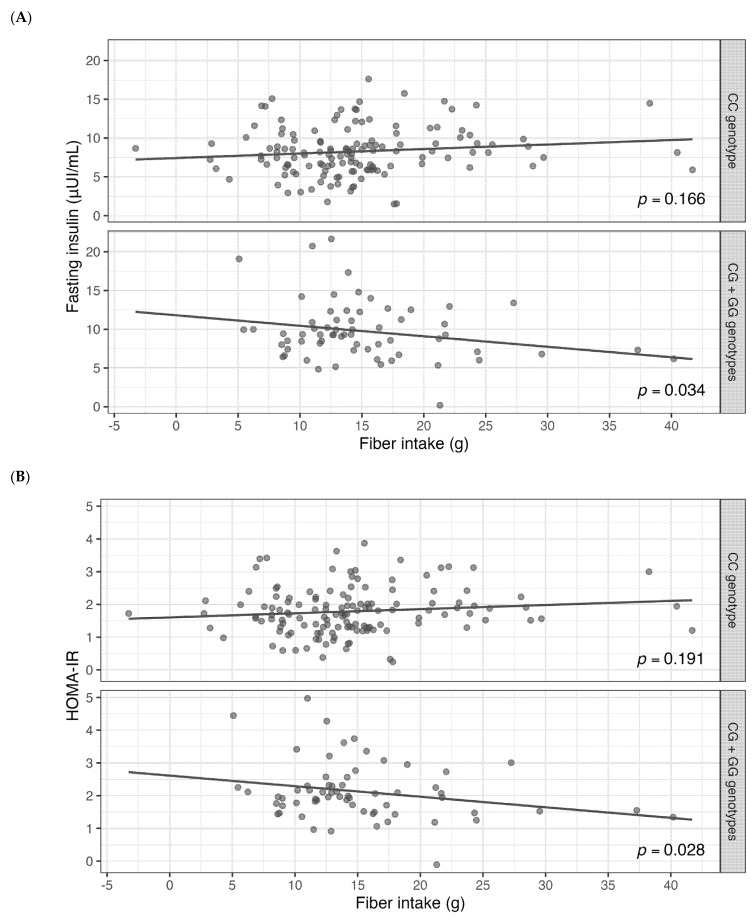
Results: The carriers of the G allele exhibited a positive association with fasting insulin levels (p = 0.003), insulin/glucose ratio (p = 0.004), HOMA-IR (p = 0.003), and HOMA-β (p = 0.018). Energy-adjusted fiber intake showed a significant genotype-specific interaction only in carriers of the G allele, where higher dietary fiber intake was significantly associated with lower fasting insulin (pinteraction = 0.034) and HOMA-IR (pinteraction = 0.028).
Conclusion: Our findings indicate that the MTNR1B rs10830963 polymorphism is associated with glycemic markers, and dietary fiber intake may attenuate the adverse effects of the MTNR1B rs10830963 G allele on glycemic profiles in young Brazilian adults. This highlights the potential role of fiber in improving health outcomes for individuals carrying this risk allele. To validate these results and assess the broader implications for the Brazilian population, further intervention studies and larger-scale research are essential.
Keywords: fiber; food intake; glycemia; nutrigenetics; precision nutrition.
Conflict of interest statement
The authors have no conflicts of interest to declare.
Figures

References
-
- World Health Organization . HEARTS: Technical Package for Cardiovascular Disease Management in Primary Health Care. World Health Organization; Geneva, Switzerland: 2016.
-
- World Health Organization Obesity: Preventing and managing the global epidemic. Report of a WHO consultation. World Health Organ. Tech. Rep. Ser. 2000;894:1–253. - PubMed
-
- International Diabetes Federation . IDF Diabetes Atlas. 10th ed. International Diabetes Federation; Brussels, Belgium: 2021. [(accessed on 17 February 2025)]. Available online: https://www.diabetesatlas.org.
-
- GBD 2015 Risk Factors Collaborators Global, regional, and national comparative risk assessment of 79 behavioural, environmental and occupational, and metabolic risks or clusters of risks, 1990–2015: A systematic analysis for the Global Burden of Disease Study 2015. Lancet. 2016;388:1659–1724. doi: 10.1016/S0140-6736(16)31679-8. - DOI - PMC - PubMed
MeSH terms
Substances
Grants and funding
LinkOut - more resources
Full Text Sources
Medical
