

Genome-Wide Characterization and Analysis of the FH Gene Family in Medicago truncatula Under Abiotic Stresses
- PMID: 40428377
- PMCID: PMC12111191
- DOI: 10.3390/genes16050555
Genome-Wide Characterization and Analysis of the FH Gene Family in Medicago truncatula Under Abiotic Stresses
Abstract
Background: The formin family proteins play an important role in guiding the assembly and nucleation of linear actin and can promote the formation of actin filaments independently of the Arp2/3 complex. As a key protein that regulates the cytoskeleton and cell morphological structure, the formin gene family has been widely studied in plants such as Arabidopsis thaliana and rice.
Methods: In this study, we conducted comprehensive analyses, including phylogenetic tree construction, conserved motif identification, co-expression network analysis, and transcriptome data mining.
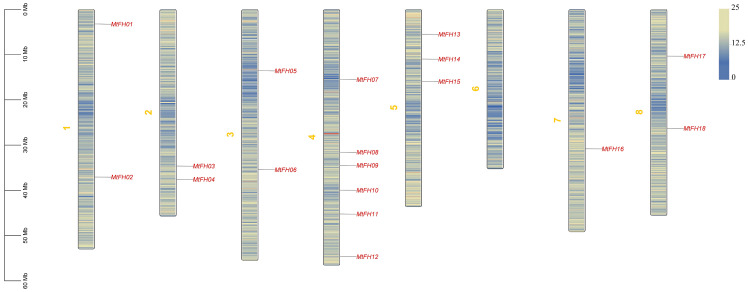
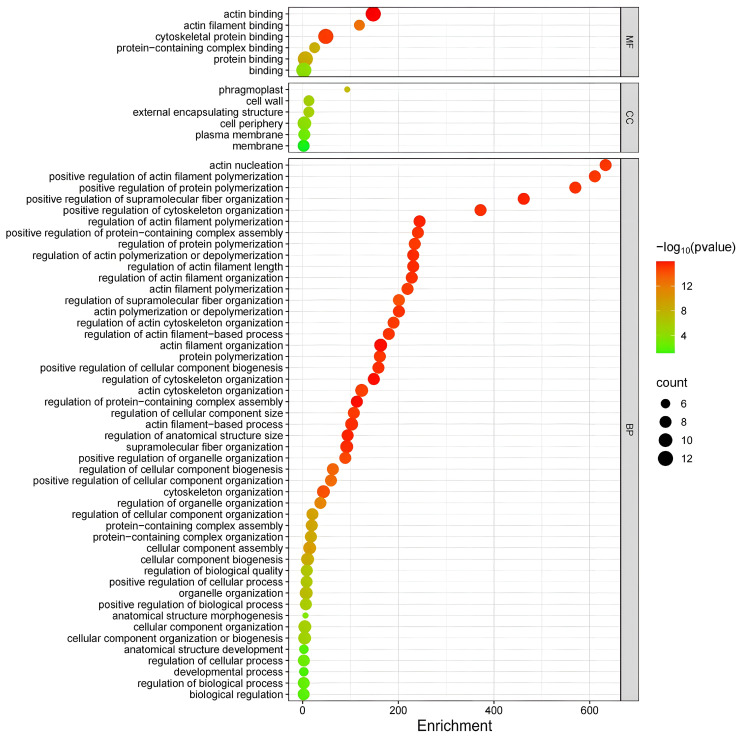
Results: A total of 18 MtFH gene family members were identified, and the distribution of these genes on chromosomes was not uniform. The phylogenetic tree divided the FH proteins of the four species into two major subgroups (Clade I and Clade II). Notably, Medicago truncatula and soybean exhibited closer phylogenetic relationships. The analysis of cis-acting elements revealed the potential regulatory role of the MtFH gene in light response, hormone response, and stress response. GO enrichment analysis again demonstrated the importance of FH for reactions such as actin nucleation. Expression profiling revealed that MtFH genes displayed significant transcriptional responsiveness to cold, drought, and salt stress conditions. And there was a temporal complementary relationship between the expression of some genes under stress. The protein interaction network indicated an interaction relationship between MtFH protein and profilin, etc. In addition, 22 miRNAs were screened as potential regulators of the MtFH gene at the post-transcriptional level.
Conclusions: In general, this study provides a basis for deepening the understanding of the physiological function of the MtFH gene and provides a reference gene for stress resistance breeding in agricultural production.
Keywords: Medicago truncatula; abiotic stress; formins.
Conflict of interest statement
The authors declare no conflicts of interest.
Figures

 represents FH members of Glycine max,
  represents FH members of Oryza sativa,
  represents FH members of Arabidopsis thaliana.
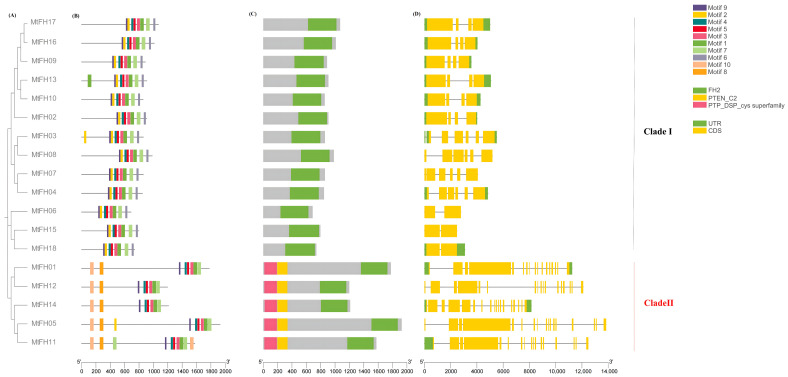


Similar articles
-
Genome-wide identification, characterization and expression profiles of FORMIN gene family in cotton (Gossypium Raimondii L.).BMC Genom Data. 2024 Dec 18;25(1):105. doi: 10.1186/s12863-024-01285-z. BMC Genom Data. 2024. PMID: 39695391 Free PMC article.
-
Calmodulin-Like (CML) Gene Family in Medicago truncatula: Genome-Wide Identification, Characterization and Expression Analysis.Int J Mol Sci. 2020 Sep 27;21(19):7142. doi: 10.3390/ijms21197142. Int J Mol Sci. 2020. PMID: 32992668 Free PMC article.
-
Genome-Wide Identification and Expression Profiling Analysis of the Trihelix Gene Family Under Abiotic Stresses in Medicago truncatula.Genes (Basel). 2020 Nov 23;11(11):1389. doi: 10.3390/genes11111389. Genes (Basel). 2020. PMID: 33238556 Free PMC article.
-
Genome-wide identification and characterization of Calcium-Dependent Protein Kinase (CDPK) gene family in autotetraploid cultivated alfalfa (Medicago sativa subsp. sativa) and expression analysis under abiotic stresses.BMC Plant Biol. 2024 Dec 23;24(1):1241. doi: 10.1186/s12870-024-05993-7. BMC Plant Biol. 2024. PMID: 39716096 Free PMC article.
-
A genome-wide study of the lipoxygenase gene families in Medicago truncatula and Medicago sativa reveals that MtLOX24 participates in the methyl jasmonate response.BMC Genomics. 2024 Feb 19;25(1):195. doi: 10.1186/s12864-024-10071-1. BMC Genomics. 2024. PMID: 38373903 Free PMC article.
References
MeSH terms
Substances
LinkOut - more resources
Full Text Sources
Research Materials
Miscellaneous
