

Core Exercise as Non-Pharmacological Strategy for Improving Metabolic Health in Prediabetic Women
- PMID: 40428900
- PMCID: PMC12113010
- DOI: 10.3390/medicina61050942
Core Exercise as Non-Pharmacological Strategy for Improving Metabolic Health in Prediabetic Women
Abstract
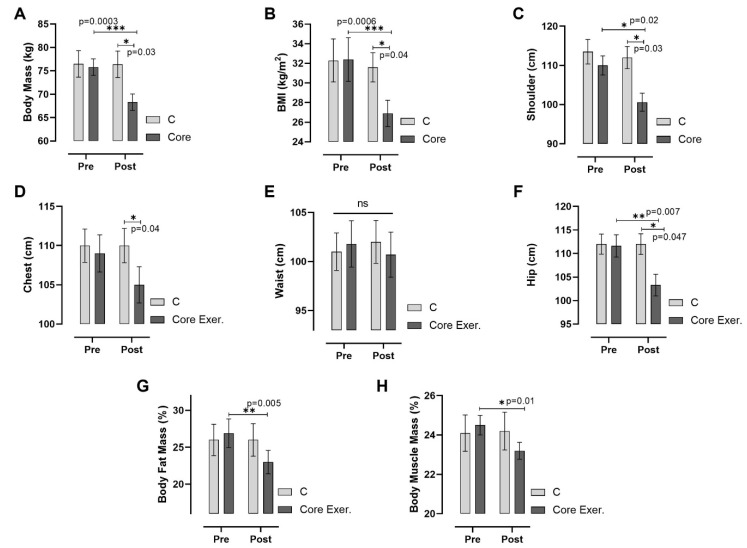
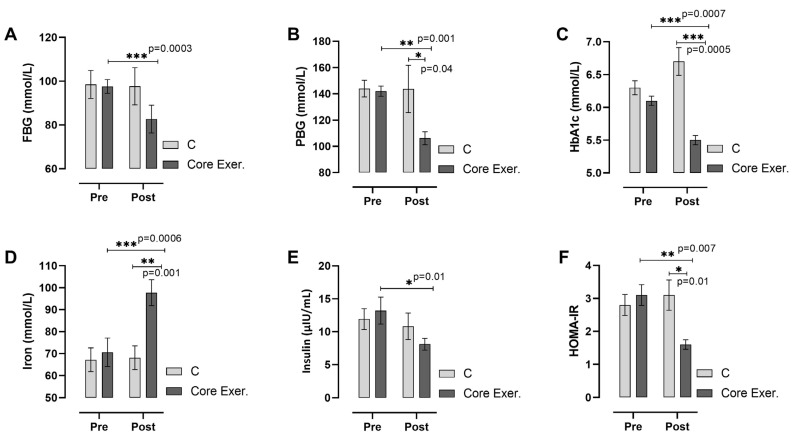
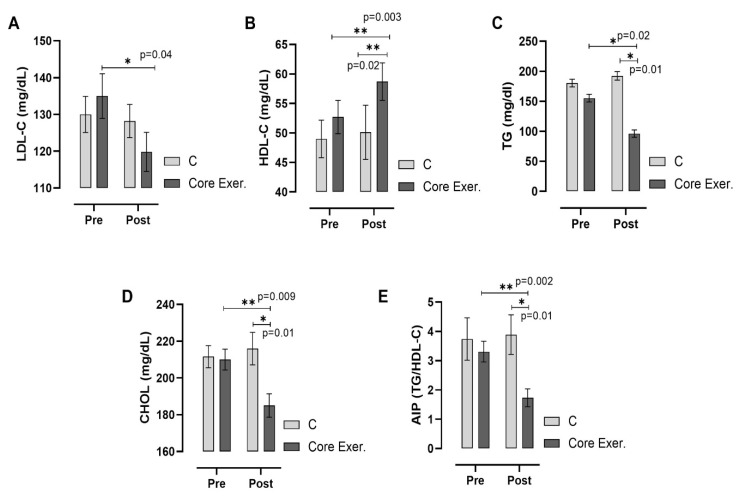
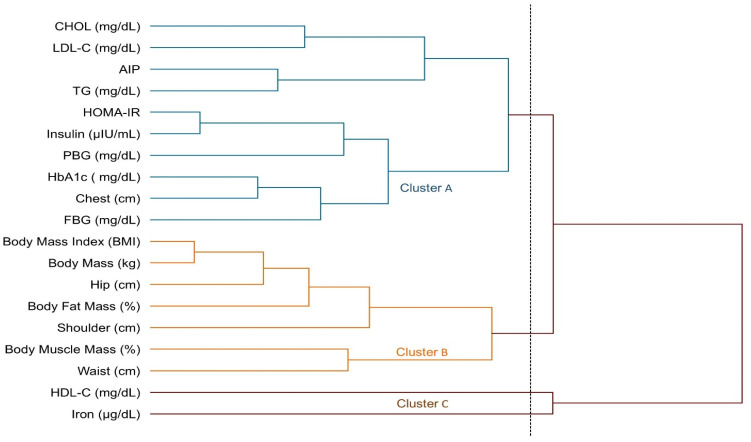
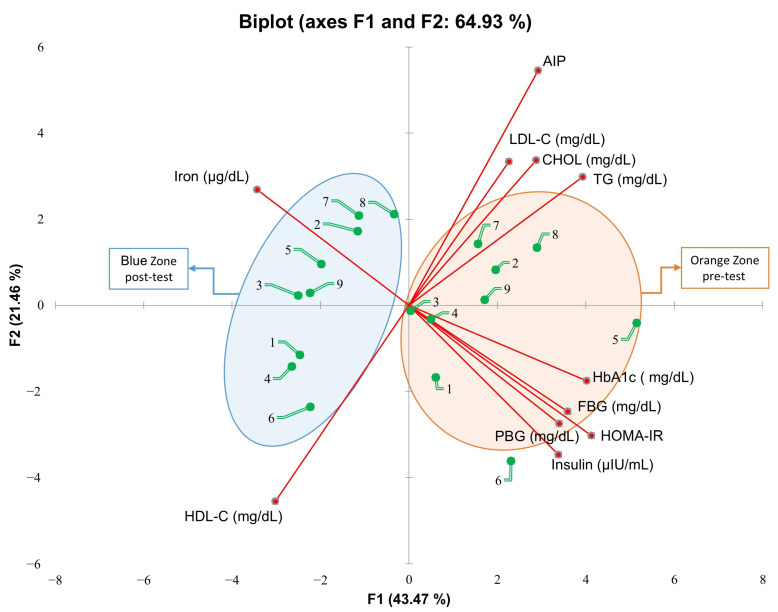
Background and Objectives: Prediabetes (PD) is characterized by impaired glucose metabolism and is associated with an elevated risk of type 2 diabetes and cardiovascular diseases. This study aimed to investigate the effects of an 8-week core exercise intervention on glycemic control, lipid profiles, insulin sensitivity, body composition, and physical performance in prediabetic women. Materials and Methods: Eighteen prediabetic women aged 20-55 years were randomly allocated to either a core exercise group (n = 9) or a control group (n = 9). The intervention group completed 24 supervised core exercise sessions over 8 weeks, whereas the control group remained sedentary. Pre- and post-intervention evaluations included anthropometric measurements, flexibility and strength tests, fasting and postprandial glucose levels, HbA1c, insulin, HOMA-IR, lipid profiles, and serum iron levels. Non-parametric tests were used for statistical analysis, and a Principal Component Analysis (PCA) and hierarchical clustering were conducted to explore multidimensional metabolic changes. Results: Core exercise significantly improved the body weight, BMI, fat percentage, and circumferences (shoulder, chest, and hip), along with an enhanced flexibility and back-leg strength (p < 0.05). Glycemic indices (FBG, PBG, and HbA1c), insulin, and HOMA-IR levels were significantly reduced, while serum iron and HDL-C increased (p < 0.05). Lipid markers, including the TG, LDL-C, CHOL, and TG/HDL-C ratio, showed significant improvements. The PCA and cluster analyses identified three clusters reflecting metabolic risk, body composition, and protective factors. Conclusions: This study demonstrates that an 8-week structured core exercise program significantly improves glycemic control, lipid profiles, insulin sensitivity, and body composition in women with prediabetes. Multivariate analyses (PCA and hierarchical clustering) corroborate a metabolic shift towards a reduced insulin resistance and a more favorable cardiometabolic profile, supporting core training as a viable, evidence-based non-pharmacological intervention to mitigate metabolic risk.
Keywords: body composition; core training; glycemic control; insulin resistance; lipid profile; prediabetes.
Conflict of interest statement
The authors declare no conflicts of interest.
Figures


Similar articles
-
The effects of supervised aerobic training on dyslipidaemia among diabetic older patients.BMC Endocr Disord. 2024 Oct 9;24(1):212. doi: 10.1186/s12902-024-01745-8. BMC Endocr Disord. 2024. PMID: 39385223 Free PMC article.
-
Comparisons of different exercise interventions on glycemic control and insulin resistance in prediabetes: a network meta-analysis.BMC Endocr Disord. 2021 Sep 6;21(1):181. doi: 10.1186/s12902-021-00846-y. BMC Endocr Disord. 2021. PMID: 34488728 Free PMC article.
-
Effects of 12-week moderate aerobic exercise on ROCK2 activity, hs-CRP and glycemic index in obese patients with impaired glucose tolerance.Physiol Behav. 2022 Dec 1;257:113976. doi: 10.1016/j.physbeh.2022.113976. Epub 2022 Sep 29. Physiol Behav. 2022. PMID: 36183850 Clinical Trial.
-
Optimal dosage and modality of exercise on glycemic control in people with prediabetes: a systematic review and network meta-analysis.Front Endocrinol (Lausanne). 2025 Apr 28;16:1560676. doi: 10.3389/fendo.2025.1560676. eCollection 2025. Front Endocrinol (Lausanne). 2025. PMID: 40357204 Free PMC article.
-
Effect of combined aerobic exercise and resistance training on postmenopausal women with type 2 diabetes: a systematic review and meta-analysis.Gynecol Endocrinol. 2025 Dec;41(1):2450338. doi: 10.1080/09513590.2025.2450338. Epub 2025 Jan 11. Gynecol Endocrinol. 2025. PMID: 39797630
References
-
- Kindlovits R., Sousa A.C., Viana J.L., Milheiro J., Marques F., Teixeira V.H. Combined low-carbohydrate diet and long-term exercise in hypoxia in type 2 diabetes: A randomized controlled trial protocol to assess glycemic control, cardiovascular risk factors and body composition. Nutr. Health. 2024;30:5–13. doi: 10.1177/02601060231190663. - DOI - PMC - PubMed
-
- Teixeira P.P., Zucatti K.P., Matzenbacher L.S., Wayerbacher L.F., Zhang M., Colpani V., Gerchman F. Long-term lifestyle intervention can reduce the development of type 2 diabetes mellitus in subjects with prediabetes: A systematic review and meta-analysis. Diabetes Res. Clin. Pract. 2024;210:111637. doi: 10.1016/j.diabres.2024.111637. - DOI - PubMed
-
- Neeraja M., Vani L., Vijitha P.A. Study on lipid profile and body mass index (BMI) in adult females with sedentary and active life styles. Eur. J. Cardiovasc. Med. 2023;13:247–251.
Publication types
MeSH terms
Substances
Grants and funding
LinkOut - more resources
Full Text Sources
Medical
Miscellaneous
