

Genomic Analysis Reveals the Role of New Genes in Venom Regulatory Network of Parasitoid Wasps
- PMID: 40429215
- PMCID: PMC12112512
- DOI: 10.3390/insects16050502
Genomic Analysis Reveals the Role of New Genes in Venom Regulatory Network of Parasitoid Wasps
Abstract
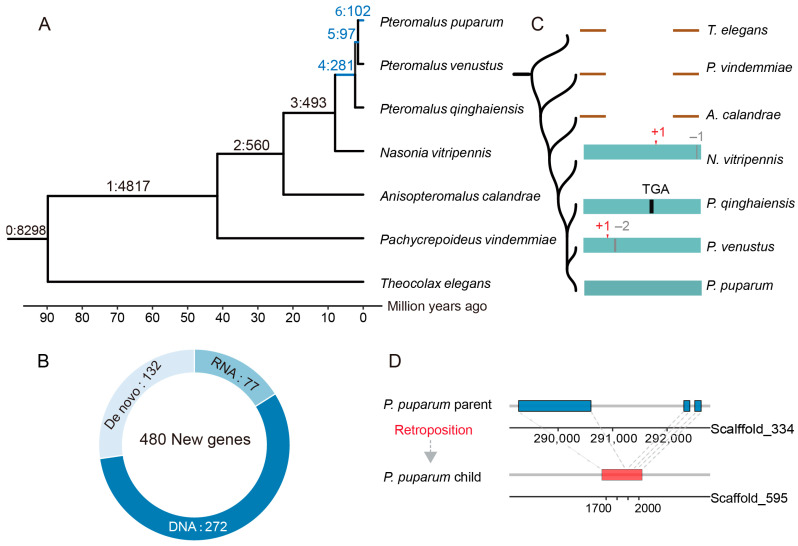
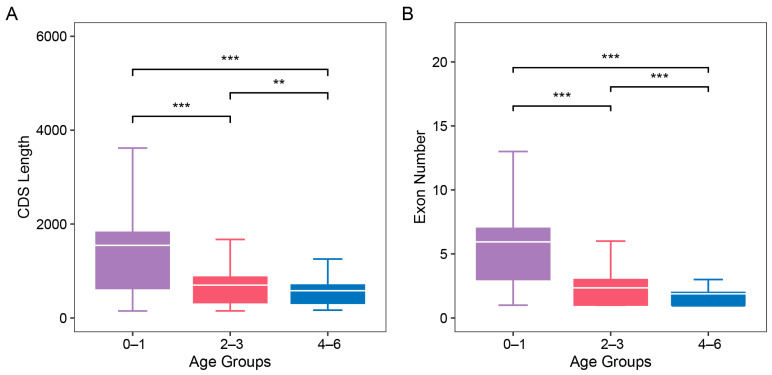
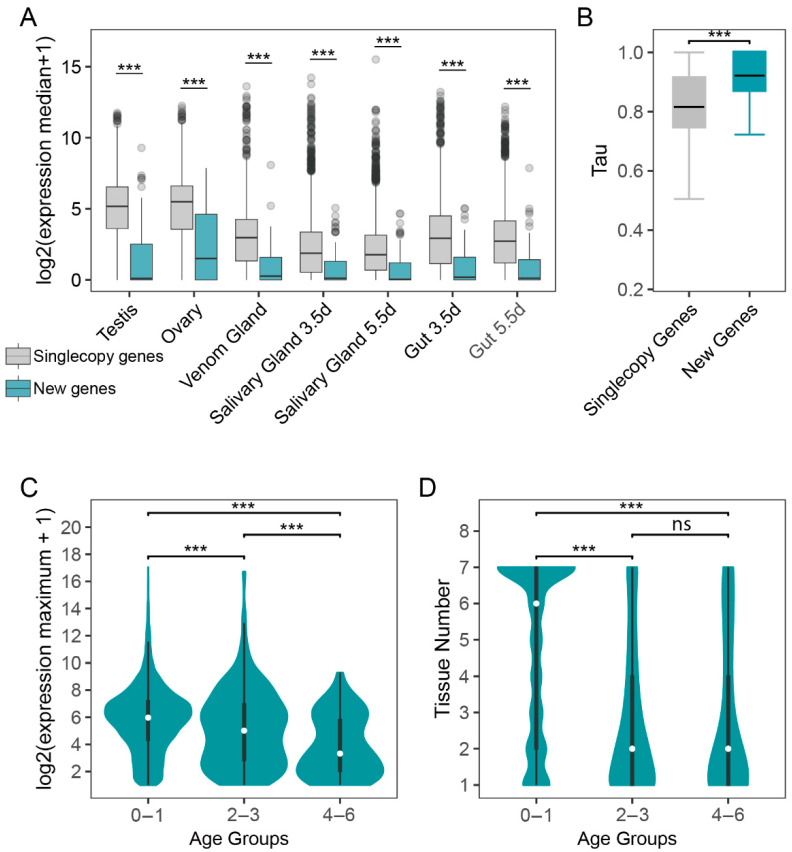
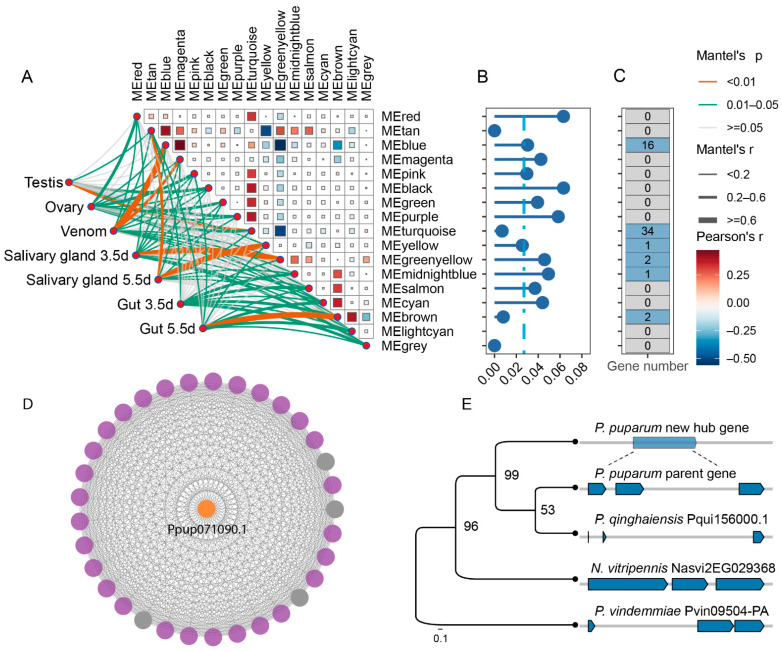
New genes play a critical role in phenotypic diversity and evolutionary innovation. Parasitoid wasps, a highly abundant and diverse group of insects, parasitize other arthropods and exhibit remarkable evolutionary adaptations, such as evading host immune responses and exploiting host resources. However, the specific contributions of new genes to their unique traits remain poorly understood. Here, we identified 480 new genes that emerged after the Nasonia-Pteromalus divergence. Among these, 272 (56.7%) originated through DNA-mediated duplication, representing the largest proportion, followed by 77 (16.0%) derived from RNA-mediated duplication and 131 (27.3%) that arose de novo. Comparative analysis revealed that these new genes generally have shorter coding sequences and fewer exons compared to single-copy older genes conserved in the seven parasitoid wasps. These new genes are predominantly expressed in the reproductive glands and exhibit venom gland-biased expression. Notably, gene co-expression network analysis further identified that a new gene may act as a hub by interacting with older genes to regulate venom-related networks rather than directly encoding venom proteins. Together, our findings provide novel insights into the role of new genes in driving venom innovation in parasitoid wasps.
Keywords: evolution; gene regulatory network; new gene; parasitoid wasp; venom.
Conflict of interest statement
The authors declare no conflicts of interest.
Figures
Similar articles
-
Host and venom evolution in parasitoid wasps: does independently adapting to the same host shape the evolution of the venom gland transcriptome?BMC Biol. 2024 Aug 15;22(1):174. doi: 10.1186/s12915-024-01974-2. BMC Biol. 2024. PMID: 39148049 Free PMC article.
-
Laterally Transferred Gene Recruited as a Venom in Parasitoid Wasps.Mol Biol Evol. 2016 Apr;33(4):1042-52. doi: 10.1093/molbev/msv348. Epub 2015 Dec 29. Mol Biol Evol. 2016. PMID: 26715630 Free PMC article.
-
A chromosome-level genome assembly of the parasitoid wasp Pteromalus puparum.Mol Ecol Resour. 2020 Sep;20(5):1384-1402. doi: 10.1111/1755-0998.13206. Epub 2020 Jul 13. Mol Ecol Resour. 2020. PMID: 32562592
-
The state of parasitoid wasp genomics.Trends Parasitol. 2024 Oct;40(10):914-929. doi: 10.1016/j.pt.2024.08.003. Epub 2024 Sep 2. Trends Parasitol. 2024. PMID: 39227194 Review.
-
Venom Proteins from Parasitoid Wasps and Their Biological Functions.Toxins (Basel). 2015 Jun 26;7(7):2385-412. doi: 10.3390/toxins7072385. Toxins (Basel). 2015. PMID: 26131769 Free PMC article. Review.
References
Grants and funding
LinkOut - more resources
Full Text Sources
