. 2025 May 8;26(10):4466.
doi: 10.3390/ijms26104466.

Beyond Trypanosoma cruzi: LINE-1 Activation as a Driver of Chronic Inflammation in Chagas Disease

Affiliations

Beyond Trypanosoma cruzi: LINE-1 Activation as a Driver of Chronic Inflammation in Chagas Disease

Marina Dias et al. Int J Mol Sci. .

Abstract

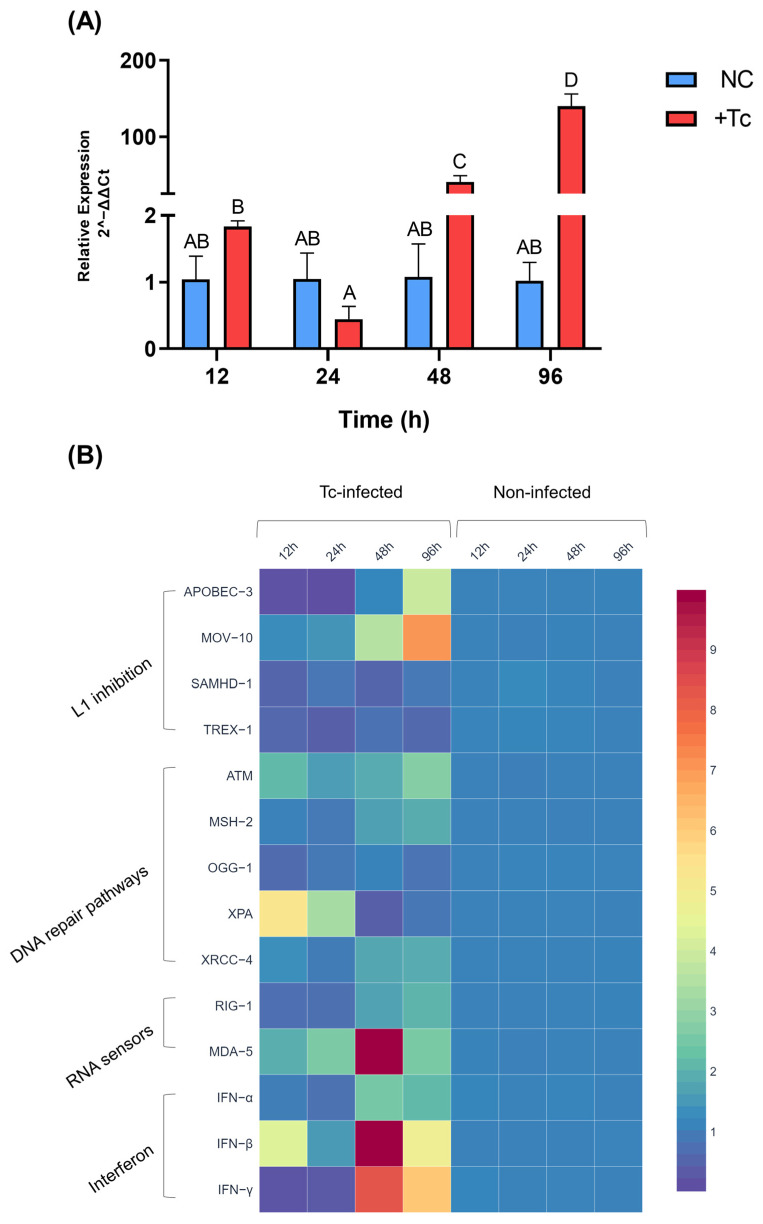
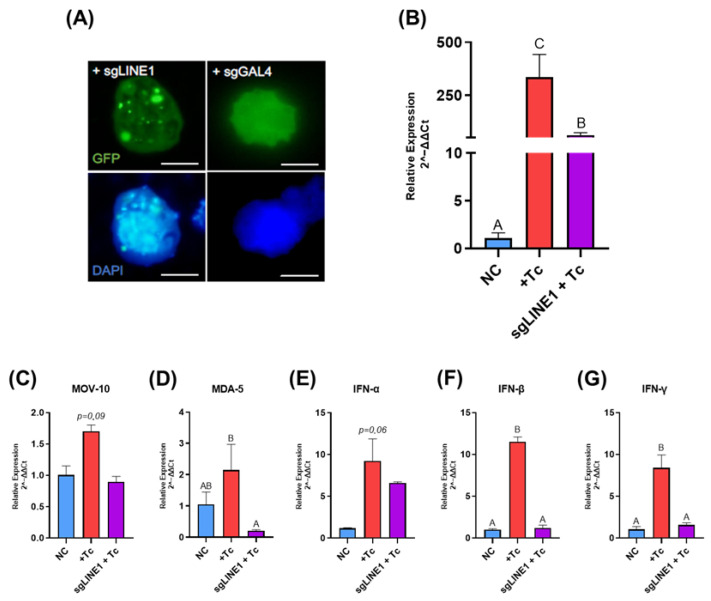
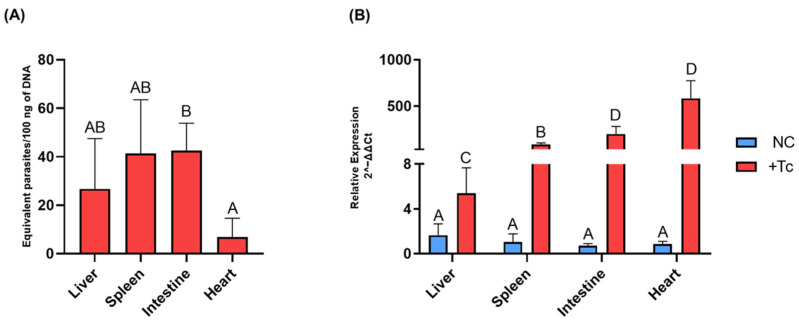
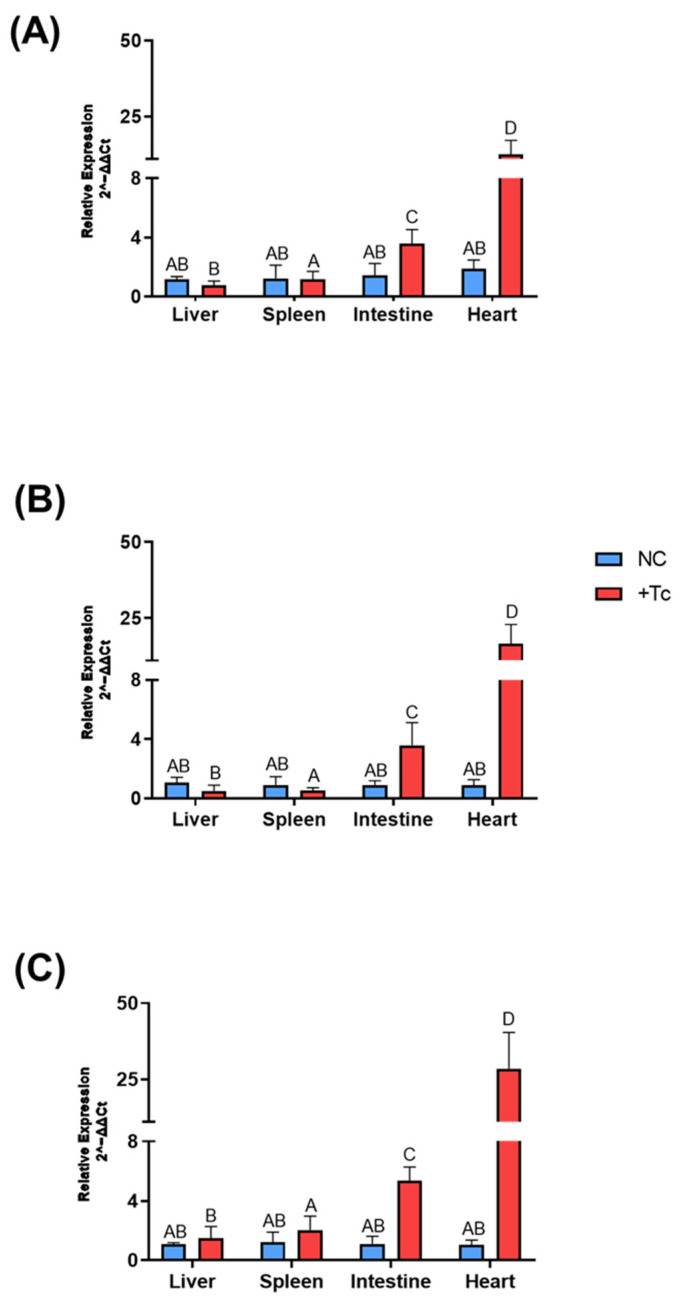
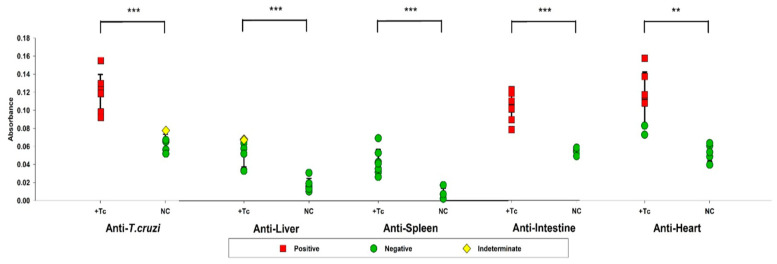
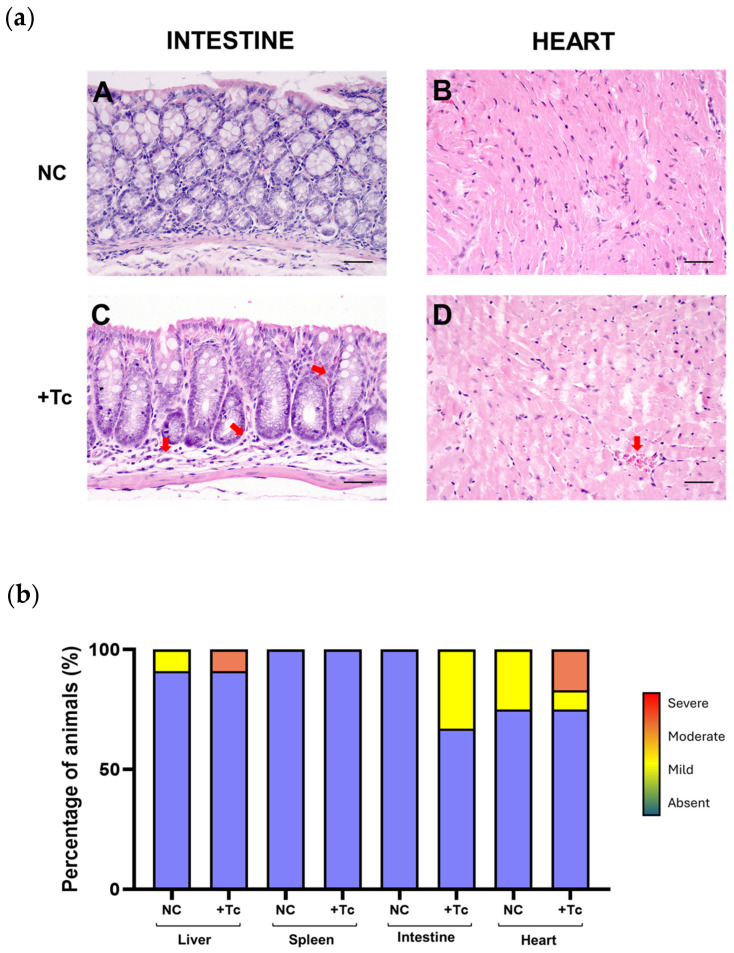
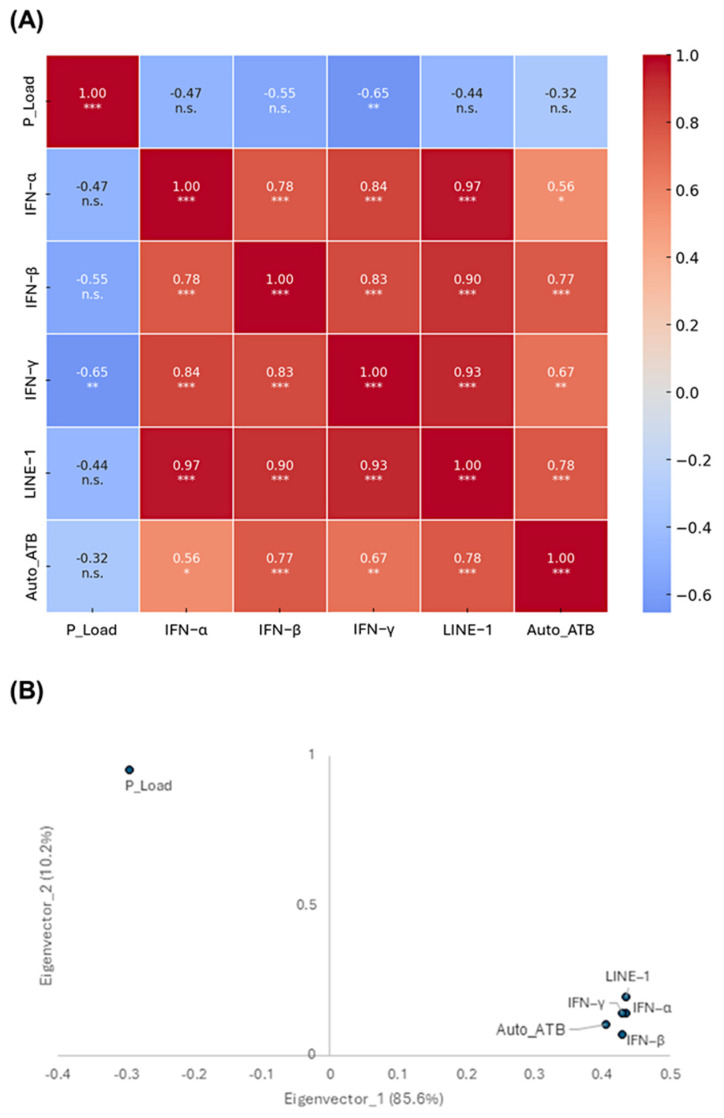
Chagas disease (CD) is endemic in Latin America, with its pathogenesis linked to Trypanosoma cruzi (Tc) persistence and autoimmune responses. This study investigates the role of LINE-1 (L1) activation in inflammation and loss of self-tolerance during Tc infection. In vitro assays evaluated the expression of genes involved in L1 regulation and interferon signaling under basal conditions and following L1 suppression via CRISPR/dCas9. In vivo analyses in a murine model included L1 and IFN expression profiling, autoantibody quantification, and histopathological assessments of liver, spleen, intestine, and heart. Tc infection induced L1 upregulation, correlating with an increased expression of its inhibitors, MOV-10 and APOBEC-3, suggesting host-driven regulatory mechanisms. L1 activation was also associated with the upregulation of DNA repair pathways (MMR and NHEJ) and RNA-sensing pathways (MDA-5 and RIG-I), leading to type I interferon responses. In the murine model, L1 expression was highest in the intestine and heart, independent of parasite burden, and correlated with increased interferon gene expression and autoantibody production. Our findings suggest that CD pathogenesis involves L1-induced chronic inflammation, which may contribute to late-stage symptoms. This highlights self-recognition mechanisms in disease severity and reveals potential therapeutic targets for novel treatments.

Keywords: Chagas disease; LINE-1 retroelement; Trypanosoma cruzi; autoimmune response; inflammation; interferons.


Conflict of interest statement

The authors declare no conflicts of interest.

Figures

Figure 1
Figure 1
Trypanosoma cruzi induces LINE-1 overexpression and activates interferon signaling in vitro. (A) Relative expression of LINE-1 in Tc-infected (red) and non-infected (blue) HEK-293 cells over time. Different letters indicate statistically significant differences between groups (p < 0.0001). (B) Heatmap depicting the relative expression of genes involved in LINE-1 regulation, including inhibitory factors, DNA repair pathways, nucleic acid sensors, and interferons. Gene expression levels were calculated using the 2−ΔΔCt method. NC: negative control, non-infected cells. +Tc: cells infected with T. cruzi.
Figure 2
Figure 2
CRISPR/dCas9-mediated LINE-1 inhibition alters immune response gene expression during Trypanosoma cruzi infection. (A) HEK-293 cells transfected with guide RNAs targeting LINE-1 (sgLINE1) or a non-human genome sequence (sgGAL4) were imaged at 48 hpi. Images were captured at 100× magnification with a 200 ms exposure time. Scale bar, 10 µm. (BG) Relative expression of LINE-1 (B), MOV-10 (C), MDA-5 (D), IFN-α (E), IFN-β (F), and IFN-γ (G). Gene expression levels were quantified using the 2−ΔΔCt method and are presented as means ± standard deviation. Statistically significant differences between groups are denoted by different letters. NC: negative control, non-infected cells. +Tc: cells infected with T. cruzi. sgLINE-1 + Tc: cells transfected with guide RNAs targeting LINE-1 (sgLINE-1) prior to T. cruzi infection.
Figure 3
Figure 3
Parasite load and LINE-1 expression in various organs of mice during the chronic phase of Chagas disease. (A) Absolute quantification of T. cruzi burden in tissue samples, determined by qPCR targeting the Tc40s region of T. cruzi cDNA. (B) Relative expression of LINE-1 in different organs of BALB/c mice, either infected or uninfected with T. cruzi. Gene expression was quantified using the 2−ΔΔCt method. Data are presented as mean ± standard deviation, with different letters indicating statistically significant differences between groups. NC: negative control, non-infected cells. +Tc: cells infected with T. cruzi.
Figure 4
Figure 4
Expression of interferons associated with the immune response in various tissues of BALB/c mice, either infected or uninfected with Trypanosoma cruzi. Gene expression levels were quantified using the 2−ΔΔCt method. Data are presented as mean ± standard deviation for both the T. cruzi-infected group (+Tc, red bars) and the uninfected control group (NC, blue bars). The analyzed genes include (A) IFN-α, (B) IFN-β, and (C) IFN-γ. Different letters indicate statistically significant differences between samples.
Figure 5
Figure 5
Assessment of antibody production against Trypanosoma cruzi antigens and self-antigens from the liver, spleen, intestine, and heart. Serum samples from BALB/c mice, either infected or uninfected with T. cruzi, were analyzed by ELISA to quantify IgG antibody levels against T. cruzi-specific antigens and organ-derived proteins. Animals with positive serology are represented in red, those with indeterminate serology in yellow, and seronegative animals in green. Data are presented as absolute levels, and bars indicate mean + standard deviation. ** p ≤ 0.01, *** p ≤ 0.001.
Figure 6
Figure 6
Histopathological assessment of inflammatory infiltrates in Trypanosoma cruzi-infected and uninfected animals. (a) Representative histological images of intestinal and cardiac tissues from control and infected groups. The upper panel displays images of intestinal (A) and cardiac (B) tissues from control animals, both exhibiting normal histological architecture without pathological alterations. The lower panel shows intestinal (C) and cardiac (D) tissues from infected animals, highlighting the presence of inflammatory infiltrates, indicated by red arrows. Hematoxylin and eosin (HE) staining. Scale bar: 100 μm. (b) Proportion of animals presenting inflammatory infiltrates in the liver, spleen, heart, and intestine, assessed at 90 dpi in the infected group and at an equivalent time point in the uninfected group. The severity of inflammation was categorized into four grades: absent (blue, 0), mild (yellow, 1), moderate (orange, 2), and severe (red, 3). NC: negative control, non-infected cells. +Tc: cells infected with T. cruzi.
Figure 7
Figure 7
Interaction of LINE-1 expression with parasite- and host-related factors in a murine model of Chagas disease. (A) Heatmap illustrates the correlation between parasite load (P_Load), autoantibody titers (Auto_ATB), interferon (IFN) production, and LINE-1 expression. Statistical significance is indicated as follows: * p < 0.05, ** p < 0.01, *** p < 0.001, and non-significant (n.s.). (B) Principal component analysis (PCA) eigenvectors representing key parameters associated with Chagas disease pathogenesis. The percentage in parentheses denotes the proportion of variance explained by each eigenvector. Variables positioned within the same quadrant exhibit similar behavior.

Similar articles

References

    1. World Health Organization (WHO) Chagas Disease (American Trypanosomiasis) WHO; Geneva, Switzerland: 2024. [(accessed on 17 March 2025)]. Available online: https://www.who.int/news-room/fact-sheets/detail/chagas-disease-(america...
    1. Pérez-Molina J.A., Molina I. Chagas disease. Lancet. 2018;391:82–94. doi: 10.1016/S0140-6736(17)31612-4. - DOI - PubMed
    1. Guarner J. Chagas disease as example of a reemerging parasite. Semin. Diagn. Pathol. 2019;36:164–169. doi: 10.1053/j.semdp.2019.04.008. - DOI - PubMed
    1. Pierrotti L.C., Carvalho N.B., Amorin J.P., Pascual J., Kotton C.N., López-Vélez R. Chagas disease recommendations for solid-organ transplant recipients and donors. Transplantation. 2018;102:S1–S7. doi: 10.1097/TP.0000000000002019. - DOI - PubMed
    1. Teixeira A.R.L., Hecht M.M., Guimaro M.C., Sousa A.O., Nitz N. Pathogenesis of chagas’ disease: Parasite persistence and autoimmunity. Clin. Microbiol. Rev. 2011;24:592–630. doi: 10.1128/CMR.00063-10. - DOI - PMC - PubMed

LinkOut - more resources