. 2025 May 9;26(10):4507.
doi: 10.3390/ijms26104507.

Peroxisome Proliferator-Activated Receptors (PPARs) May Mediate the Neuroactive Effects of Probiotic Metabolites: An In Silico Approach

Affiliations

Peroxisome Proliferator-Activated Receptors (PPARs) May Mediate the Neuroactive Effects of Probiotic Metabolites: An In Silico Approach

Irving Parra et al. Int J Mol Sci. .

Abstract

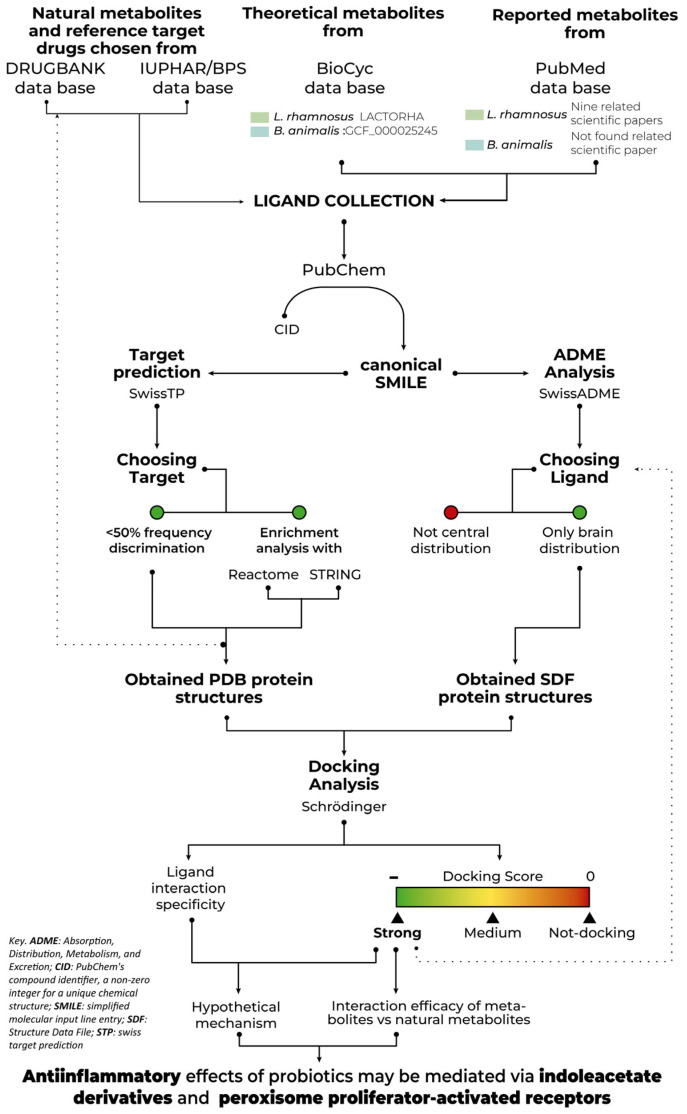
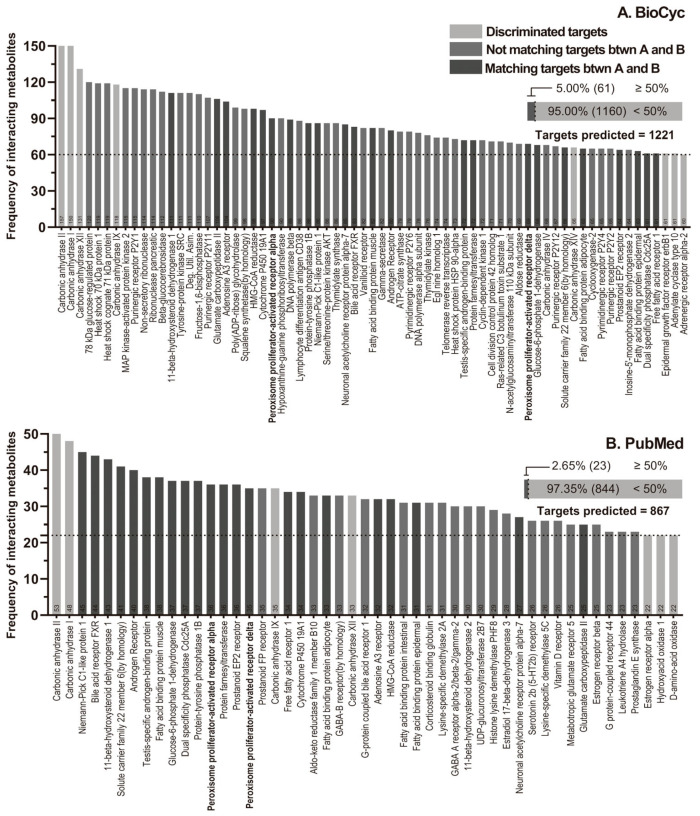
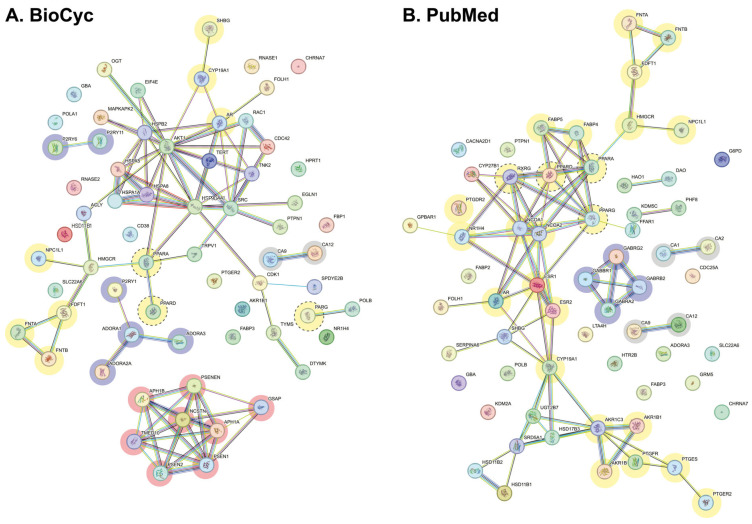
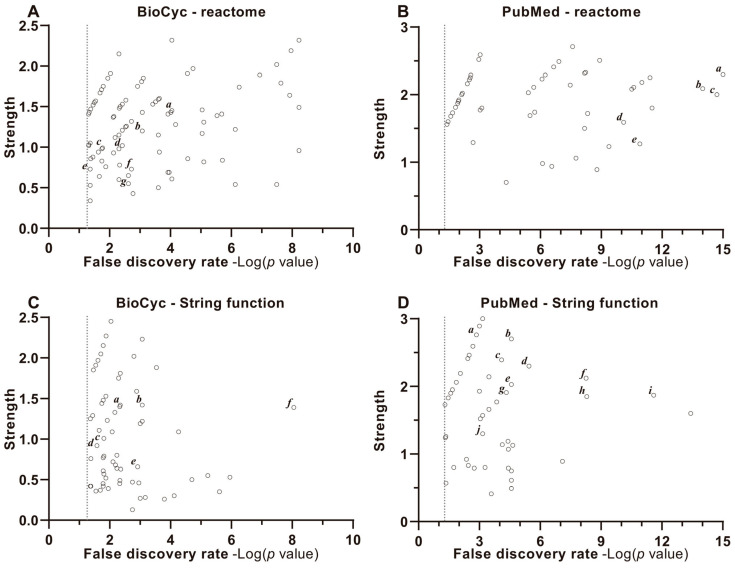
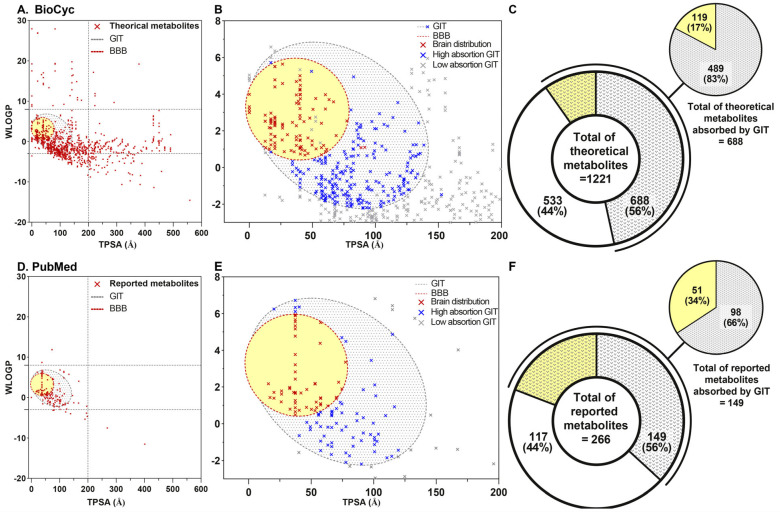
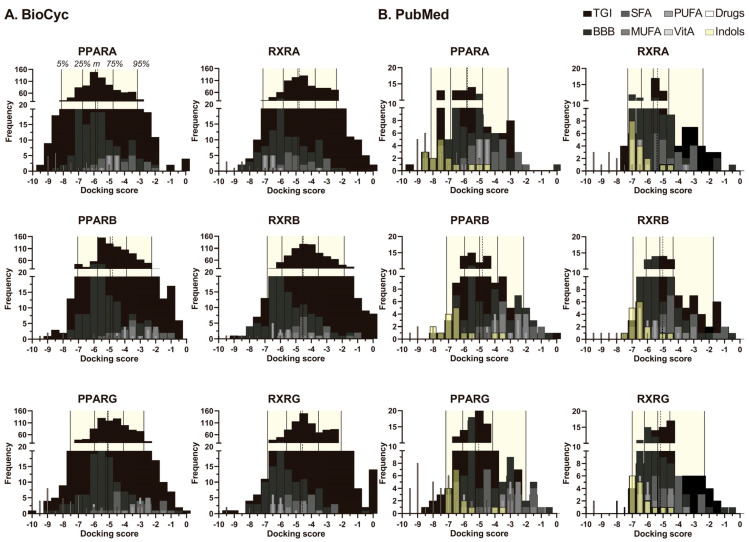
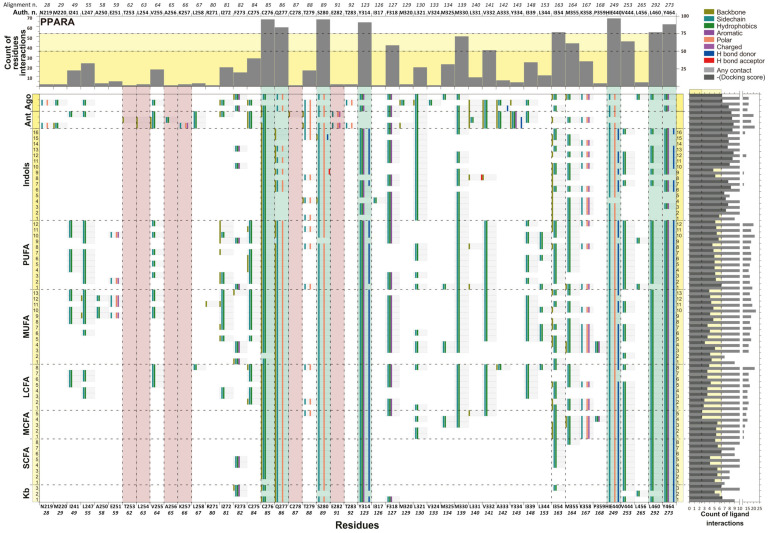
It is well established that the gut-brain axis (GBA) is a bidirectional communication between the gut and the brain. This axis, critical in maintaining overall homeostasis, is regulated at the neuronal, endocrine, and immunological levels, all of which may be influenced by the gut microbiota (GM). Therefore, dysbiosis or disruption in the GM may have serious consequences including neuroinflammation due to overactivation of the immune system. Strategies to reestablish GM integrity via use of probiotics are being pursued as novel therapeutic intervention in a variety of central and peripheral diseases. The mechanisms leading to dysbiosis or efficacy of probiotics, however, are not fully evident. Here, we performed computational analysis on two major probiotics, namely Lactobacillus Lacticaseibacillus rhamnosus GG (formerly named Lactobacillus rhamnosus, L. rhamnosus GG) and Bifidobacterium animalis spp. lactis (B. lactis or B. animalis) to not only shed some light on their mechanism(s) of action but also to identify potential molecular targets for novel probiotics. Using the PubMed web page and BioCyc Database Collection platform we specifically analyzed proteins affected by metabolites of these bacteria. Our results indicate that peroxisome proliferator-activated receptors (PPARs), nuclear receptor proteins that are involved in regulation of inflammation are key mediators of the neuroactive effect of probiotics.

Keywords: PPARs; gut microbiota; gut-brain axis; metabolites; neuroinflammation; neuroprotection; probiotics.


Conflict of interest statement

The authors declare no conflicts of interest.

Figures

Figure 1
Figure 1
In-silico working diagram depicting theoretical and reported metabolites from L. rhamnosus and B. animalis by BioCyc Database (DB) Collection and PubMed DB. We interexchanged PubChem Compound ID list (CID) and canonical Simplified Molecular Input Line Entry Specification codes (SMILE) by PubChem platform to perform all the in-silico analysis. Targets were selected through 2D/3D target prediction, a frequency plot and an enrichment analysis. Natural metabolites, reference drugs, and protein crystals were recuperated by DrugBank Online (Academic version), International Union of Basic and Clinical Pharmacology (IUPHAR)/British Pharmacological Society (BPS) Guide to PHARMACOLOGY and Protein Data Bank (PDB), respectively. Through absorption, distribution, metabolism and excretion (ADME) theoretical analyses, only the metabolites identified in the brain were chosen. Structures of those metabolites were selected via 2D Structure Data File (SDF) for docking analysis. Based on the docking score, a second set of metabolites with a strong energy of interaction (most negative docking score) were identified. Collectively, the information extracted provided a hypothetical mechanism of action for probiotics.
Figure 2
Figure 2
Cumulative frequency graphs. The graphs of cumulative frequencies of the target proteins are shown for the metabolites produced by the bacteria L. rhamnosus LGG and B. animalis spp. lactis BB12 according to the BioCyc database (A) and the metabolites derived from the literature review in PubMed (B). (A). STP predicted 1121 target and 1160 targets were discriminated against. (B). STP predicted 867 targets and 844 were discriminated against. Note that the transparency in the bars denotes that these proteins were ignored because they interacted little in the subsequent analyses. 22 similar proteins (dark gray) were identified among BioCyc and PubMed prediction models. Light gray: discriminated targets; medium gray: no matches between models; dark gray: coincidences between both models. Horizontal dot line indicates 50% of maximum frequency of interactions.
Figure 3
Figure 3
STRING Interactome. Figure shows interaction networks of the predicted target proteins for the metabolites produced by the bacteria L. rhamnosus LGG and B. animalis spp. lactis BB12 according to the BioCyc database (A), and the metabolites derived from the literature review in PubMed (B). Metabolites with a minimum interaction score of 0.7 and maximum of 5 are depicted. Validation model and Network Stats are shown in Supplementary Table S1. Interactions between proteins are indicated in color-equivalent categories, namely: experimentally determined (purple), neighboring genes (green), fused genes (red), co-occurrence (dark blue), co-expression (black), database (clear blue), summary of the scientific literature (text mining, yellow). Node color-coding delineates functional specialization: purple nodes denote proteins linked to neurotransmission or neuromodulation, yellow nodes emphasize lipid metabolism-associated proteins, yellow and dot line circles denote PPARs, orange nodes highlight the gamma-secretase complex, and gray nodes represent carbonic anhydrases, which exhibited no significant interactions within this network.
Figure 4
Figure 4
Enrichment, strength, and validation plots of protein interactions. The functional enrichment graphs of the metabolic pathways and protein–protein interaction obtained from the Reactome (A,B) and STRING (C,D) databases are shown. The x-axis represents Discovery Rate measured by −Log10(p-value), so the vertical dotted line represents −Log10(0.05) = 1.3, signifying the enrichment. Also shown are p-values corrected for multiple testing within each category using the Benjamini–Hochberg procedure. The y axis depicts the measured strength of Log10 (observed/expected), showing how large the enrichment effect is. It represents the ratio between (i) the number of proteins in our network that are annotated with a term and (ii) the number of proteins that are expected to be annotated with this term in a random network of the same size. Each open dot represents a protein function, pathway or cellular and molecular role of the cluster of targets analyzed. (A) BioCyc—Reactome. a. nuclear receptor transcription pathway; b. FCGR, a FcγR (Fc gamma receptor)-dependent phagocytosis; c. PPARA activating gene expression; d. signaling by neurotrophic tyrosine receptor kinase (NTRK); e. signaling by nuclear receptors; f. neutrophil degranulation; g. innate immune system. (B) PubMed—Reactome. a. nuclear receptor transcription pathway; b. transcriptional regulation of white adipocyte differentiation; c. PPARA activates gene expression; d. signaling by nuclear receptors; e. metabolism of lipids. (C) BioCyc—String Function. a. transcription coactivator binding; b. nuclear receptor activity; c. organic acid binding; d. carboxylic acid binding; e. lipid binding; f. Heat shock proteins (HSP) binding. (D) PubMed—String Function. a. DNA binding domain; b. lipid binding domain; c. nuclear retinoid x binding; d. nuclear retinoid acid receptor binding; e. transcription coactivator binding; f. nuclear receptor activity; g. nuclear receptor coactivator activity; h. transcription coregulation binding; i. nuclear receptor binding; j. transcription coactivator activity.
Figure 5
Figure 5
Boiled egg model for predicting the absorption of metabolites into the GIT or BBB. (A,B): molecules produced by the bacteria L. rhamnosus LGG and B. animalis spp. lactis BB12 according to the BioCyc database, (D,E): metabolites derived from the literature review in PubMed, and (C,F): number of metabolites absorbed by GIT and distributed to the brain. Additionally, the (A,D) plot shows all metabolites analyzed; (B,E), shows low absorption (gray dot cross), high absorption (blue dot cross) and BBB metabolites crossing (red dot cross and yellow). Epithelia of the GIT are limited by gray dotted line and BBB are limited by red dotted line. Total of theoretical metabolites (C) and total of reported metabolites (F) are shown. Metabolites of the BioCyc model (AC) numbered 1221, of which 688 metabolites could cross GIT epithelia and 119 could cross the BBB. PubMed model metabolites (DF) numbered 266, of which 149 metabolites could cross GIT epithelia, and 51 could cross the BBB.
Figure 6
Figure 6
Discrimination of metabolites by frequency in the docking score. Histogram displaying the distribution of docking scores for different groups of metabolites produced by the bacteria L. rhamnosus LGG and B. animalis spp. lactis BB12 according to the BioCyc database (A) and the metabolites derived from the literature review in PubMed (B) across PPARs and RXRs. The metabolite categories include those capable of crossing the gastrointestinal tract (GIT, black), those that cross the blood–brain barrier (BBB, dark gray), reference molecules (SFA, MUFA, PUFA, Vitamin A; gray scale), specific drugs (white), and indole-derived metabolites (yellow). Vertical lines indicate key percentiles: 5th, 25th, median, mean, 75th, and 95th. The middle continuous line represents the median, while the middle-dotted line represents the mean. Supplementary Table S2 shows relevant data distribution around the median. Table 1 provides relevant data on score of metabolites with BBB permeability ranked above the 95th percentile.
Figure 7
Figure 7
Interaction map or interaction fingerprint of PPARA nuclear protein. The map of interactions between nuclear receptor residues (horizontal axis) and natural metabolites, drug reference and indole metabolites are shown (vertical axis). The upper quadrant shows the frequency of any contact (light gray) of the residues with respect to the metabolites, and the yellow panel and dotted line indicate specific residues that interact with ≤50% and ≤75% of total metabolites, respectively. The number of aminoacidic residues are according to alignment and author crystal numbering. The right quadrant shows the frequency of any interactions of the metabolites, with respect to amino acid residues (light gray) and the negative of docking score (dark gray), and the dotted line and yellow panel indicate the maximum and minimum docking score of reference metabolites, respectively. The main window shows the specific interaction of each amino acid residue and the type of interaction with each of the metabolites. Horizontal dots indicate the limit of different metabolites or drugs and are labelled by a number relevant to the name in Table 4 and Figure S5. Vertical dots indicate specific aminoacidic residues. Vertical green squares indicate specific aminoacidic residues that interact with >75% of metabolites. Vertical red squares indicate a specific aminoacidic residue that interacts with only an antagonist. The numbers of metabolite interactions are color-coded as follows: gray: any interaction; gold: with skeleton; turquoise: with side chain; flag green: with hydrophobic residues; purple: with residues that have aromatic rings; orange: with polar residues; magenta: with charged polar residues; blue: with hydrogen bond donors; red: with hydrogen post acceptors; and white: no interaction. Kb: ketone body; SCFA: short chain fatty acid; MCFA: medium chain FA; LCFA: long chain FA; MUFA: mono-unsaturated FA; PUFA: poly-unsaturated FA; Ant: antagonist; Ago: agonist.

Similar articles

References

    1. Abenavoli L., Scarpellini E., Colica C., Boccuto L., Salehi B., Sharifi-Rad J., Aiello V., Romano B., De Lorenzo A., Izzo A.A., et al. Gut Microbiota and Obesity: A Role for Probiotics. Nutrients. 2019;11:2690. doi: 10.3390/nu11112690. - DOI - PMC - PubMed
    1. Kelly J.R., Kennedy P.J., Cryan J.F., Dinan T.G., Clarke G., Hyland N.P. Breaking down the barriers: The gut microbiome, intestinal permeability and stress-related psychiatric disorders. Front. Cell Neurosci. 2015;9:392. doi: 10.3389/fncel.2015.00392. - DOI - PMC - PubMed
    1. Liu J., Tan Y., Cheng H., Zhang D., Feng W., Peng C. Functions of Gut Microbiota Metabolites, Current Status and Future Perspectives. Aging Dis. 2022;13:1106–1126. doi: 10.14336/AD.2022.0104. - DOI - PMC - PubMed
    1. Rea K., Dinan T.G., Cryan J.F. The microbiome: A key regulator of stress and neuroinflammation. Neurobiol. Stress. 2016;4:23–33. doi: 10.1016/j.ynstr.2016.03.001. - DOI - PMC - PubMed
    1. Kolzhetsov N., Markelova N., Frolova M., Alikina O., Glazunova O., Safonova L., Kalashnikova I., Yudin V., Makarov V., Keskinov A., et al. Enterotype-Dependent Probiotic-Mediated Changes in the Male Rat Intestinal Microbiome In Vivo and In Vitro. Int. J. Mol. Sci. 2024;25:4558. doi: 10.3390/ijms25084558. - DOI - PMC - PubMed

MeSH terms

Substances

LinkOut - more resources