

Active Constituent of HQS in T2DM Intervention: Efficacy and Mechanistic Insights
- PMID: 40429723
- PMCID: PMC12111589
- DOI: 10.3390/ijms26104578
Active Constituent of HQS in T2DM Intervention: Efficacy and Mechanistic Insights
Abstract
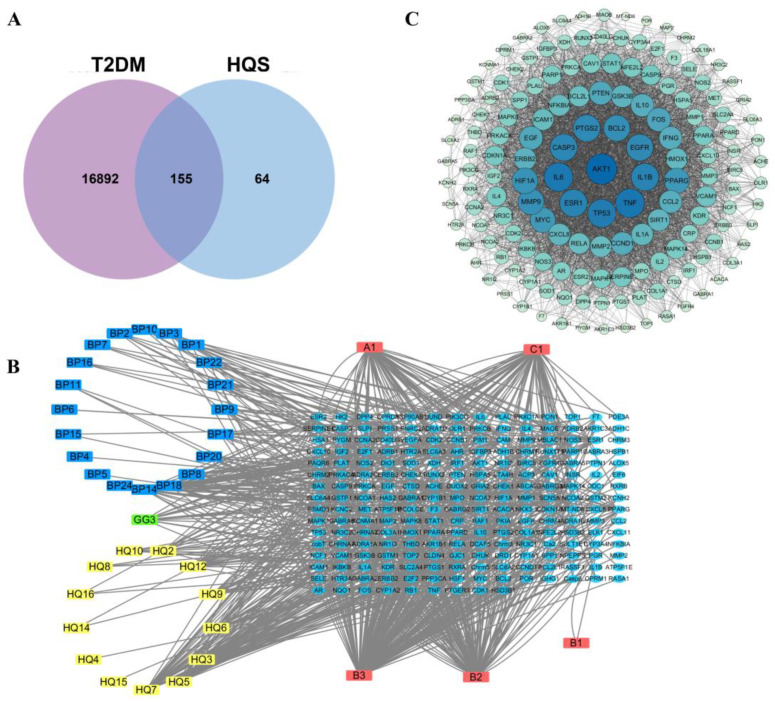
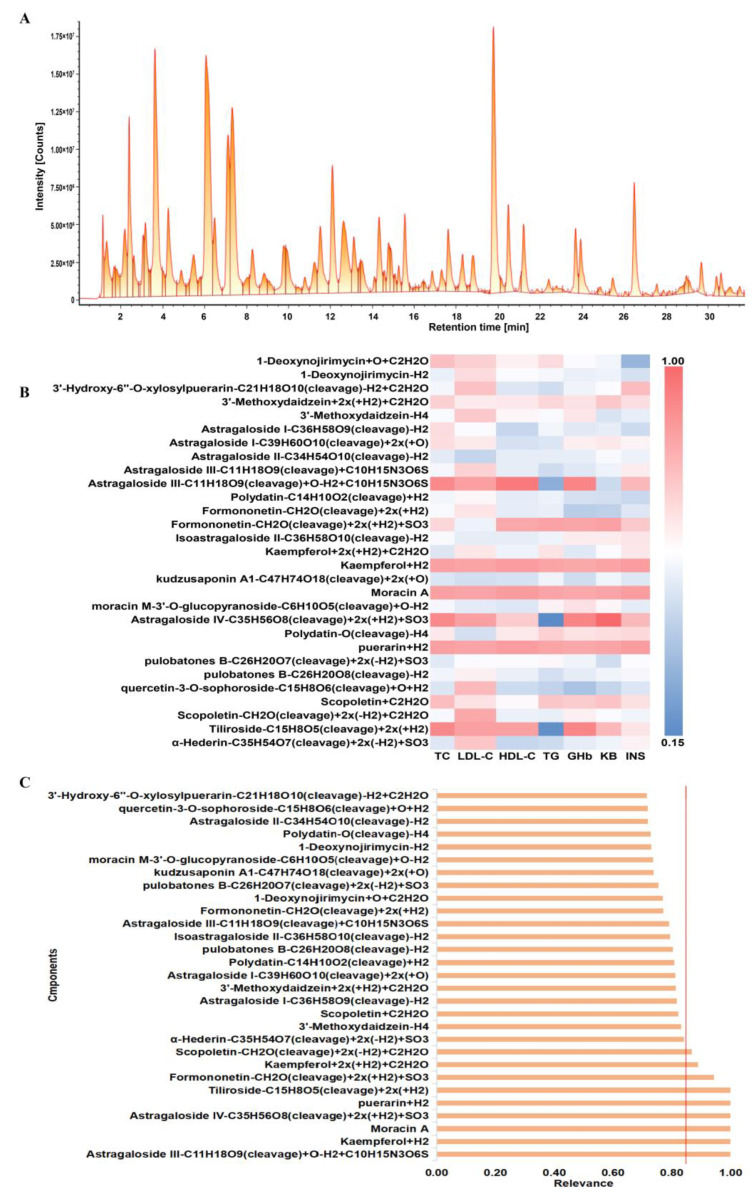
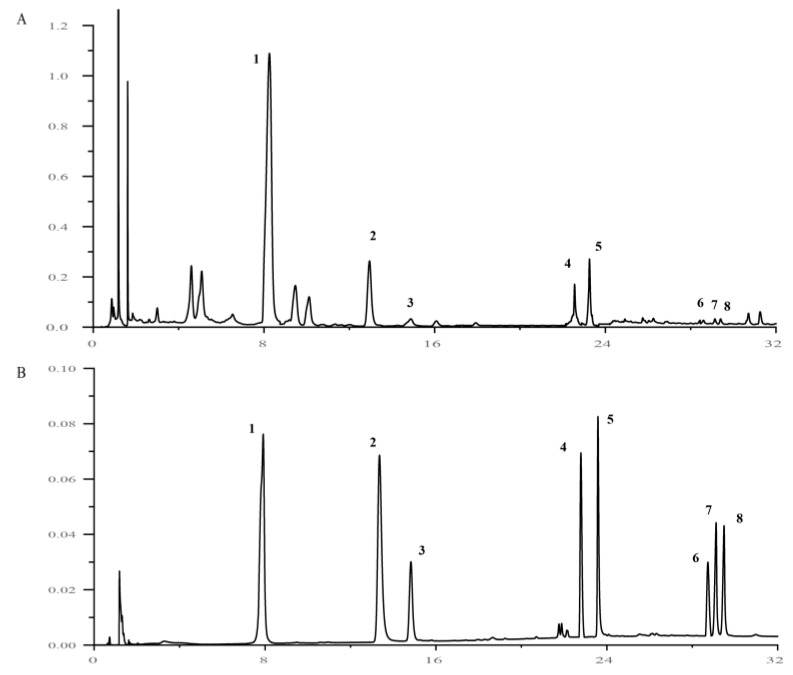
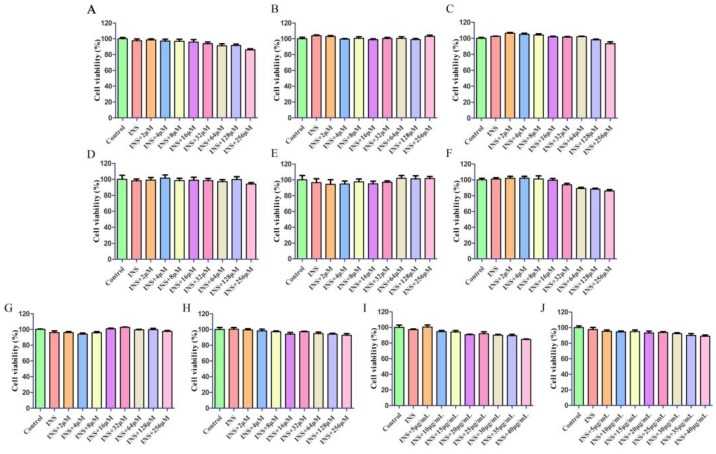
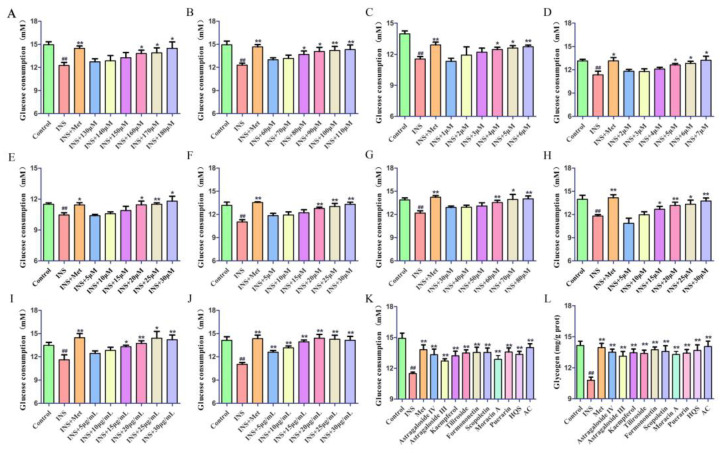
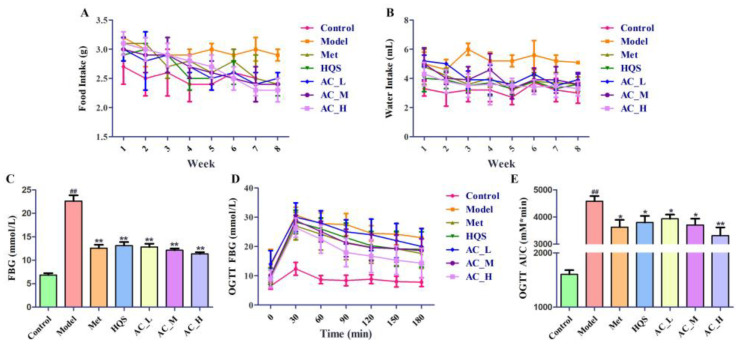
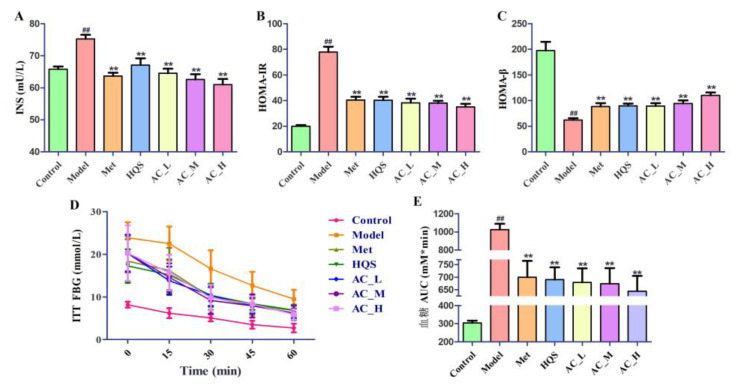
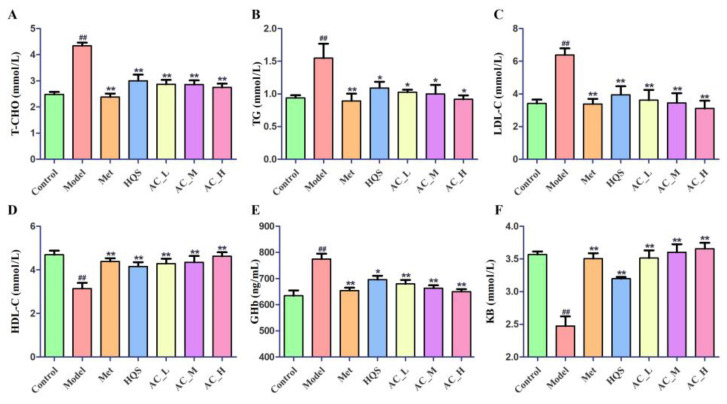
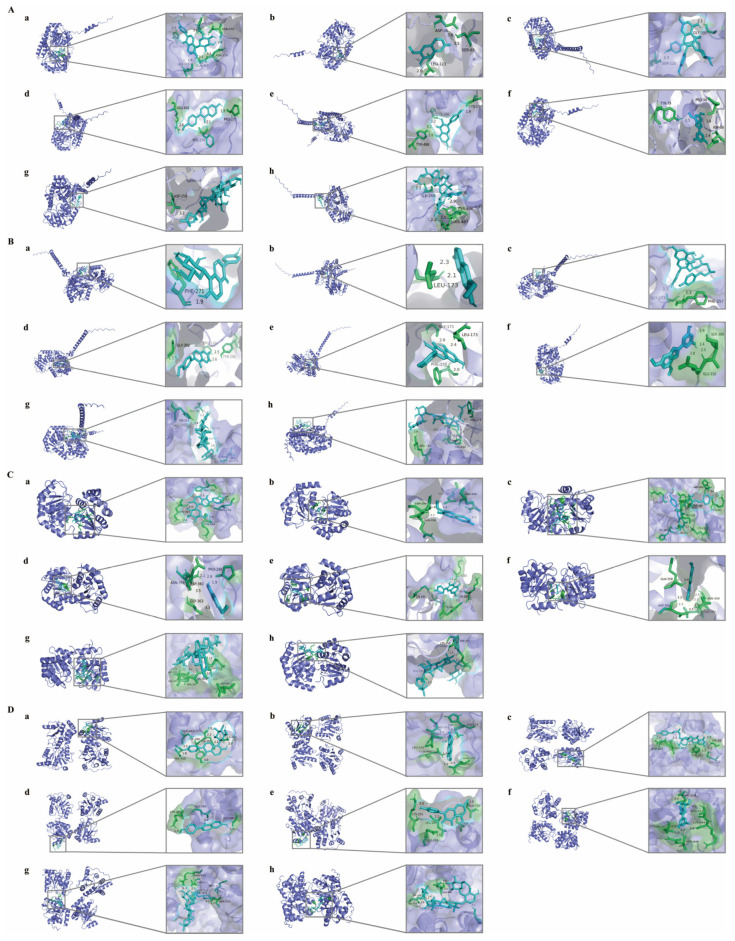
Traditional Chinese Medicine (TCM) is recognized for its complex composition and multiple therapeutic targets. Current pharmacological research often concentrates on extracts or individual components. The former approach faces numerous challenges, whereas the latter oversimplifies and disregards the synergistic effects of TCM components. This study aimed to address this limitation by evaluating the therapeutic efficacy and mechanisms of Huang-Qi San (HQS) active constituent (AC) against type 2 diabetes (T2DM). Active components of HQS were identified using network pharmacology and spectrum-effect correlation analysis. The reconstituted AC group was assessed both in vitro (for glucose consumption and glycogen synthesis) and in vivo (in T2DM mice), with metabolomics and molecular docking techniques used to elucidate the underlying mechanisms. Eight components exhibiting a correlation degree greater than 0.85 were identified as the representative components of HQS intervention for T2DM. These eight components were then mixed in equal proportions to produce AC. The AC group demonstrated increased glucose uptake and glycogen synthesis in vitro, surpassing both the HQS extract and individual components. In diabetic mice, AC significantly increased the insulin sensitivity, outperforming the HQS extract and matching the efficacy of metformin. Metabolomics analysis identified pentose and glucuronic acid interconversion as a critical metabolic pathway, with strong binding affinity (less than -15 kJ/mol) between AC and key enzymes. This research further substantiates the scientific validity and feasibility of emphasizing active constituents in the evaluation of TCM efficacy. Additionally, it provides a scientific foundation for the clinical application of HQS. Most importantly, this study serves as a demonstration of the development of new TCM drugs characterized by clear ingredients, safety, and effectiveness.
Keywords: Huang-Qi San; active constituent; potential pharmacodynamic ingredients; type 2 diabetes.
Conflict of interest statement
The authors declare no conflicts of interest.
Figures
Similar articles
-
Scientific Validation of Using Active Constituent as Research Focus in Traditional Chinese Medicine: Case Study of Pueraria lobata Intervention in Type 2 Diabetes.Pharmaceuticals (Basel). 2024 Dec 12;17(12):1675. doi: 10.3390/ph17121675. Pharmaceuticals (Basel). 2024. PMID: 39770517 Free PMC article.
-
New insights into the pharmacological mechanisms of Jinqi Jiangtang Tablets in the treatment of type 2 diabetes mellitus: A multi-omics approach combined with experimental validation.J Ethnopharmacol. 2025 Jun 26;350:120020. doi: 10.1016/j.jep.2025.120020. Epub 2025 May 29. J Ethnopharmacol. 2025. PMID: 40449695
-
Network pharmacology analysis revealed the mechanism and active compounds of jiao tai wan in the treatment of type 2 diabetes mellitus via SRC/PI3K/AKT signaling.J Ethnopharmacol. 2025 Jan 30;337(Pt 2):118898. doi: 10.1016/j.jep.2024.118898. Epub 2024 Oct 5. J Ethnopharmacol. 2025. PMID: 39374878
-
Mechanism of Traditional Chinese Medicine extract in the treatment of diabetic erectile dysfunction.J Ethnopharmacol. 2025 Feb 11;341:119332. doi: 10.1016/j.jep.2025.119332. Epub 2025 Jan 6. J Ethnopharmacol. 2025. PMID: 39778785 Review.
-
Study on the active ingredients and mechanism of action of Jiaotai Pill in the treatment of type 2 diabetes based on network pharmacology: A review.Medicine (Baltimore). 2023 Mar 31;102(13):e33317. doi: 10.1097/MD.0000000000033317. Medicine (Baltimore). 2023. PMID: 37000070 Free PMC article. Review.
References
-
- Liu R., Wang J., Zhao Y., Zhou Q., Yang X., Gao Y., Li Q., Bai M., Liu J., Liang Y., et al. Study on the Mechanism of Modified Gegen Qinlian Decoction in Regulating the Intestinal Flora-Bile Acid-TGR5 Axis for the Treatment of Type 2 Diabetes Mellitus Based on Macro Genome Sequencing and Targeted Metabonomics Integration. Phytomedicine. 2024;132:155329. doi: 10.1016/j.phymed.2023.155329. - DOI - PubMed
-
- Meng X., Liu X., Tan J., Sheng Q., Zhang D., Li B., Zhang J., Zhang F., Chen H., Cui T., et al. From Xiaoke to Diabetes Mellitus: A Review of the Research Progress in Traditional Chinese Medicine for Diabetes Mellitus Treatment. Chin. Med. 2023;18:75. doi: 10.1186/s13020-023-00783-z. - DOI - PMC - PubMed
MeSH terms
Substances
Grants and funding
LinkOut - more resources
Full Text Sources
Medical
