. 2025 May 10;26(10):4591.
doi: 10.3390/ijms26104591.

N-N-Substituted Piperazine, Cmp2, Improves Cognitive and Motor Functions in 5xFAD Mice

Affiliations

N-N-Substituted Piperazine, Cmp2, Improves Cognitive and Motor Functions in 5xFAD Mice

Nikita Zernov et al. Int J Mol Sci. .

Abstract

The piperazine derivative N-(2,6-difluorophenyl)-2-(4-phenylpiperazin-1-yl)propanamide (cmp2) has emerged as a potential transient receptor potential cation channel, subfamily C, member 6 (TRPC6) modulator, offering a promising pathway for Alzheimer's disease (AD) therapy. Our recent findings identify cmp2 as a novel compound with synaptoprotective effects in primary hippocampal cultures and effective blood-brain barrier (BBB) penetration. In vivo studies demonstrate that cmp2 (10 mg/kg, intraperitoneally) restores synaptic plasticity deficits in 5xFAD mice. This study further shows cmp2's selectivity towards tetrameric TRPC6 channel in silico. Acute administration of cmp2 is non-toxic, with no indications of chronic toxicity, and Ames testing confirms its lack of mutagenicity. Behavioral assays reveal that cmp2 improves cognitive functions in 5xFAD mice, including increased novel object recognition, better passing of the Morris water maze, and improved fear memory, as well as upregulation of motor function in beam walking tests. These findings suggest that cmp2 holds promise as a candidate for AD treatment.

Keywords: Alzheimer’s disease; TRPC6 channel; behavior; piperazine.


Conflict of interest statement

The authors declare no conflicts of interest.

Figures

Figure 1
Figure 1
Results of molecular dynamic simulations performed for cmp2 complexes with tetrameric TRPC3 and TRPC6. (A,B) RMSD values obtained from the complex formation simulations for two targets (TRPC3 and TRPC6) with cmp2 over a 100 ns duration. Calculated interaction energies of cmp2 with TRPC3 and TRPC6 complexes: (C,D) Coulombic, (E,F) Van der Waals, and (G) hydrogen interactions. The red line is a a linear trend line for average value of the obtained energy.
Figure 2
Figure 2
Cmp2 and its metabolites are non-mutagenic upon Ames testing. The mutagenic properties of cmp2 were investigated in the absence (white bars) and presence (grey bars) of S9 liver extract in histidine-dependent S. typhimurium strains (A) TA98, (B) TA1537, (C) TA100, (D) TA1535 and in a tryptophan-dependent E. coli strain (E). Data are presented as mean with SEM, individual data points are presented as dots. Experiment was repeated three times (n = 3). Statistical analysis was performed using the one-way ANOVA test with Dunnett’s multiple comparisons test between negative control and the other groups. ***: p < 0.001.
Figure 3
Figure 3
No significant effect on the body weight of mice was found after acute (A) or chronic (B) administration of cmp2. n (mice) = 5 (for acute toxicity test) and 8 (for chronic toxicity test). m/mo—weights were normalized to the first day of the drug administration. All data represent the mean ± SEM.
Figure 4
Figure 4
Scheme of the experiment involving male mice that were injected daily with either cmp2 at a 10 mg/kg dose or vehicle. The mice were 7.5 months old at the beginning of the experiment. The same groups of mice were used for all tests. Each behavioral test was performed at a different time point. The novel object recognition (NOR) test was performed on day 18 after first injection of cmp2; the Morris water maze (MWM) on day 20; the fear conditioning test (FC) on day 26; and the beam walking (BW) test on day 34. After the behavioral experiments, the mice were euthanized (day 39), and immunohistochemical analysis of amyloidosis and astrogliosis were performed.
Figure 5
Figure 5
Impact of cmp2 on the recognition memory of WT male mice in the NOR (A,B) and MWM (C,D) tests. (A) Exploration time of the novel object on the second day. (B) Number of head entries in the new object on the second day. The number of male mice tested per group (n): n (WT) = 6, n (WT + cmp2) = 6–7. Data are presented as mean ± SEM, and individual data points are presented as dots. Normal distribution was checked using the Shapiro–Wilk test. Statistical analysis was performed using the Mann–Whitney test or unpaired t-test. *: p < 0.05, ns: non-significant. Statistical power = 0.52.
Figure 6
Figure 6
Impact of cmp2 on the context and cued memory of WT mice in the fear conditioning test. (A) Schematic illustration of the fear conditioning paradigm. Total freezing percentage during the contextual fear conditioning test of mice performed on day 3 (B) and on day 10 (D) of the test. Total freezing percentage during the tone fear conditioning test of mice performed on day 3 (C) and on day 10 (E) of the test. The number of male mice tested per group (n): n (WT) = 6, n (WT + cmp2) = 6. All data are presented as the mean ± SD, and individual data points are presented as dots. Sample distributions were assessed for normality (Shapiro–Wilk test). p values indicate significant differences (Mann–Whitney test or t-test). ***: p < 0.001, **: p < 0.01, *: p < 0.05. Statistical power ≥ 0.6.
Figure 7
Figure 7
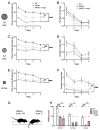
Impact of cmp2 on locomotor parameters of WT male mice in the beam walking test. (A,C,E) Graphs of the average time of beam crossing during 4 days of training on beams of 18 mm, 12 mm, and 8 mm, respectively (each experimental group consists of n = 6 mice, with three attempts for each animal). Statistical difference was measured on the 1st and 4th day. Data are presented as mean ± SEM. (B,D,F) Graphs of the number of times the mice’s paws slipped on beams of 18 mm, 12 mm, and 8 mm, respectively. Data are presented as mean ± SEM. (G) Representative picture of walking score estimation. A walking score of «100» is for a normal traverse on all paws. A walking score of «0» is for a “crawling” traverse by dragging hindlimbs. (H) Diagram of type of mice movements while beam crossing on day 4. Data are presented as mean ± SEM, and individual data points are presented as dots. Normal distribution was checked using the Shapiro–Wilk test. Statistical analysis was performed using the Mann–Whitney test or unpaired t-test. **: p < 0.01, *: p < 0.05, ns: non-significant. Statistical power ≥ 0.4.
Figure 8
Figure 8
Cmp2 improves the recognition memory of 5xFAD mice in the NOR test. (A) The arena with two equal objects (DAY 1) or with the one familiar B and the one novel Object A (DAY 2). (B) Representative mice tracks of each experimental group for day 1 and day 2. (C) Exploration time of object A. Mice from WT and 5xFAD + cmp2 groups spent more time exploring novel Object A on the second day than on the first. 5xFAD mice spent equal time exploring Object A on the first and second days. On the first day, mice did not prefer objects in terms of number of entries (D) or exploring time (F). On the second day, the number of entries to zones was significantly different across the WT and 5xFAD + cmp2 groups but not in the 5xFAD group (E). The exploring time was significantly different in all groups on the second day (G). However, the exploring time of new Object B by mice from the 5xFAD + cmp2 group was significantly higher than in the 5xFAD group. The results are presented as mean with SD, and individual data points are presented as dots. The number of mice tested per group (n): n (WT) = 8, n (5xFAD) = 8, n (5xFAD + cmp2) = 9. Normal distribution was checked using the Shapiro–Wilk test. Statistical analysis was performed using the Mann–Whitney test or t-test between two groups and one-way ANOVA following Dunnett’s multiple comparisons test between 5xFAD + cmp2 and the other treatment groups. **: p < 0.01, *: p < 0.05, ns: non-significant.
Figure 9
Figure 9
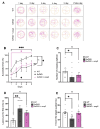
Cmp2 improves the spatial memory of 5xFAD mice in the Morris water maze task. (A) Representative swimming traces of each experimental group during the memory test. (B) Percentage of successful trials during training days. (C) Number of crossings to the platform location. (D) Latency of the first entry to the platform location. (E) Time spent in the target quadrant on the probe day. All data represent the mean ± SD (B) or SEM (C,D,E), and individual data points are presented as dots. The number of mice tested per group (n): n (WT) = 8, n (5xFAD) = 10, n (5xFAD + cmp2) = 9. Normal distribution was checked using the Shapiro–Wilk test. Statistical analysis was performed using the Kruskal–Wallis test with Dunn’s post hoc or one-way ANOVA following Dunnett’s multiple comparisons test. ***: p < 0.001, **: p < 0.01, *: p < 0.05, ns: non-significant.
Figure 10
Figure 10
Cmp2 improves the context and cued memory of 5xFAD male mice in the fear conditioning test. (A) Schematic illustration of the fear conditioning paradigm. Total freezing percentage during the contextual fear conditioning test of mice performed on day 3 (B) and on day 10 (D) of the test. Total freezing percentage during the tone fear conditioning test of mice performed on day 3 (C) and on day 10 (E) of the test. The number of mice tested per group (n): n (WT) = 9, n (5xFAD) = 10, n (5xFAD + cmp2) = 9. All data are presented as the mean ± SD, and individual data points are presented as dots. Sample distributions were assessed for normality (Shapiro–Wilk test) and homogeneity (Bartlett’s test). p values indicate significant differences (Mann–Whitney test (B,D,E) or t-tests (C,E)) between conditions (training/context or pre-tone/tone) in the same group or (Kruskal–Wallis test following Dunn’s multiple comparisons test (D)) between 5xFAD + cmp2 and the other groups of treatment. ***: p < 0.001, **: p < 0.01, *: p < 0.05, ns: non-significant.
Figure 11
Figure 11
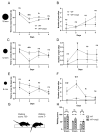
Cmp2 recovers the locomotor parameters of 5xFAD mice in the beam walking test. (A,C,E) Graphs of the average time of beam crossing during 4 days of training on beams of 18 mm, 12 mm, and 8 mm, respectively (each experimental group consists of n = 10 mice and three attempts for each animal). Statistical difference was measured on the 4th day. Data are presented as mean ± SD. (B,D,F) Graphs of the number of times the mice’s paws slipped on beams of 18 mm, 12 mm, and 8 mm, respectively. Data are presented as mean ± SD. (G) Representative picture of walking score estimation. A walking score of «100» is for a normal traverse on all paws. A walking score of «0» is for a “crawling” traverse by dragging the hindlimbs. (H) Diagram of type of mice movements while beam crossing on day 4. Data are presented as mean ± SEM, and individual data points are presented as dots. Normal distribution was checked using the Shapiro–Wilk test. Statistical analysis was performed using the Kruskal–Wallis test with Dunn’s post hoc or one-way ANOVA following Dunnett’s multiple comparisons test. * p < 0.05, ** p < 0.005, *** p < 0.0001. ns: non-significant.
Figure 12
Figure 12
Immunohistochemical staining of hippocampal Aβ-plaques with Thio-T. (A) Representative images of hippocampus of 9-month-old mice WT, 5xFAD, 5xFAD + cmp2 with Thio-T staining. (B) Quantification of percentages of Thio-T-positive plaques area per hippocampus area and number of Thio-T-positive cells per mm2. Data are presented as median ± Q1/Q3, and individual data points are presented as dots; repeated measurements were taken with the Kruskal–Wallis test and Dunn’s post hoc test. ***: p ≤ 0.0001, ns: non-significant, n = 7 mice per group.
Figure 13
Figure 13
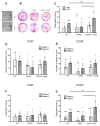
Immunohistochemistry with GFAP antibodies. (A) Representative hippocampus of WT, 5xFAD, 5xFAD + cmp2 with GFAP staining at the 9-month mice. (B) Estimation of astrogliosis through the analysis of mean grey value of hippocampus area and number of GFAP-positive cells per mm2. Data are represented as mean ± SD, and individual data points are presented as dots; repeated measurements were taken with a one-way ANOVA, Welch’s ANOVA, and Dunnett’s post hoc test. **: p ≤ 0.01, ns: non-significant, n = 7 mice per group.

Similar articles

References

    1. Karran E., Mercken M., Strooper B.D. The Amyloid Cascade Hypothesis for Alzheimer’s Disease: An Appraisal for the Development of Therapeutics. Nat. Rev. Drug Discov. 2011;10:698–712. doi: 10.1038/nrd3505. - DOI - PubMed
    1. Hardy J.A., Higgins G.A. Alzheimer’s Disease: The Amyloid Cascade Hypothesis. Science. 1992;256:184–185. doi: 10.1126/science.1566067. - DOI - PubMed
    1. Widera E.W., Brangman S.A., Chin N.A. Ushering in a New Era of Alzheimer Disease Therapy. JAMA. 2023;330:503–504. doi: 10.1001/jama.2023.11701. - DOI - PubMed
    1. Whitehouse P., Gandy S., Saini V., George D.R., Larson E.B., Alexander G.C., Avorn J., Brownlee S., Camp C., Chertkow H., et al. Making the Case for Accelerated Withdrawal of Aducanumab. J. Alzheimer’s Dis. 2022;87:1003–1007. doi: 10.3233/JAD-220262. - DOI - PubMed
    1. Wojtunik-Kulesza K., Rudkowska M., Orzeł-Sajdłowska A. Aducanumab—Hope or Disappointment for Alzheimer’s Disease. Int. J. Mol. Sci. 2023;24:4367. doi: 10.3390/ijms24054367. - DOI - PMC - PubMed

LinkOut - more resources