. 2025 May 14;26(10):4698.
doi: 10.3390/ijms26104698.

Fingolimod Prevents Neuroinflammation but Has a Limited Effect on the Development of Ataxia in a Mouse Model for SCA1

Affiliations

Fingolimod Prevents Neuroinflammation but Has a Limited Effect on the Development of Ataxia in a Mouse Model for SCA1

Chen Yang et al. Int J Mol Sci. .

Abstract

Spinocerebellar ataxia type 1 (SCA1) is a neurodegenerative disorder that predominantly affects the Purkinje cells (PCs) of the cerebellum, leading to cerebellar degeneration, motor dysfunction, and cognitive impairment. Sphingosine-1-phosphate (S1P) signaling, known to modulate neuroinflammation, has been identified as a potential therapeutic target in SCA1. To investigate the therapeutic efficacy of the S1P modulator fingolimod, we treated a mouse model for SCA1, ATXN1[82Q]/+ mice during three different periods with fingolimod and assessed the effects. Potential therapeutic effects were monitored by tracking locomotion during the treatment period and examining PC morphology, connectivity, and markers for neuroinflammation post-mortem. Fingolimod treatment reduced astrocyte and microglial activation during all three treatment periods. We found no effect on calbindin levels or the thickness of the molecular layer, but fingolimod did improve the extent of the synaptic input of climbing fibers to PCs. While fingolimod improved important aspects of cellular pathology, we could only detect signs of improvement in the locomotion phenotype when treatment started at a later stage of the disease. In conclusion, fingolimod is able to mitigate neuroinflammation, preserve aspects of PC function in SCA1, and remediate part of the ataxia phenotype when treatment is appropriately timed. Although behavioral benefits were limited, targeting S1P pathways represents a potential therapeutic strategy for SCA1. Further studies are needed to optimize treatment regimens and assess long-term outcomes.

Keywords: fingolimod; microglia; neuroinflammation; sphingosine-1-phosphate pathway; spinocerebellar ataxia type 1.


Conflict of interest statement

The authors declare no conflict of interest.

Figures
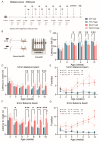
Figure 1
Figure 1
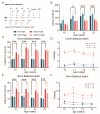
Fingolimod treatment has minimal beneficial effects on impairment in the locomotion of SCA1 mice. ATXN1[82Q] mutant and littermate control mice were injected with fingolimod or vehicle solution three times a week, starting from 2 weeks of age, and behavioral experiments were initiated from 5 weeks of age (A). Rotarod and balance beam (B) were used to track cerebellar ataxia’s development and potential recovery. Analyzed parameters include rotaod latency to fall (C), 12 mm balance beam latency to cross (D), number of foot slips (E), 6 mm balance beam latency to cross (F), and number of foot slips (G). Experimental groups consisted of nine control mice injected with vehicle (WT-Veh), nine control mice injected with fingolimod (WT-Fingo), 10 ATXN1[82Q] mice injected with vehicle (SCA1-Veh), and eight ATXN1[82Q] mice injected with fingolimod (SCA1-Fingo). The non-normally distributed rotarod, the fall latency on 12 mm BB, and foot slips on the 12 mm BB were analyzed using a mixed-effects model to compare WT-Veh with SCA1-Veh. SCA1-Veh and SCA1-Fingo were normally distributed. Therefore, a two-way ANOVA was used to assess the effect of genotype and treatment. For data that conform to a normal distribution, the fall latency on 6 mm BB, foot slips on the 6 mm BB, and a two-way ANOVA were used. All values are presented as mean ± sem.* p < 0.05, ** p < 0.01 and *** p < 0.001; only the outcomes for WT-Veh vs. SCA1-Veh, WT-Veh vs. WT-Fingo and SCA1-Veh vs. SCA1-Fingo are indicated, ns—not significant.
Figure 2
Figure 2
Fingolimod attenuates the inflammatory responses in ATXN1[82Q] mice. Overview micrographs of GFAP and Iba1 immunofluorescent labeling of the posterior cerebellum of SCA1 mice (C,D) and control littermate mice (A,B) at week 10. Higher-resolution confocal images show GFAP and Iba1 staining in the anterior cerebellum (lobule IV). (E) Analysis of the standard deviation of the intensity of GFAP labeling measured across the anterior and posterior cerebellar cortex. (F) Analysis of Iba1 intensity in the same sections. (G) Analysis of numbers of microglia in the anterior cerebellum per analyzed square. For E and F, each experimental group consisted of five mice, and for each mouse, we analyzed the entire cerebellar cortex in five sections. For (G), we analyzed at least three regions of interest per mouse for five mice per group. ML = molecular layer; PCL = Purkinje cell layer; GCL = granule cell layer. Scale bars: overview image, 500 μm; insets, 40 μm. For data that conform to a normal distribution, a two-way ANOVA was used. All values are presented as mean ± sem, circles indicate individual sample points. * p < 0.05, ** p < 0.01, and *** p < 0.001; only the outcomes for WT-Veh vs. SCA1-Veh, WT-Veh vs. WT-Fingo and SCA1-Veh vs. SCA1-Fingo are indicated, ns—not significant.
Figure 3
Figure 3
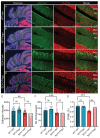
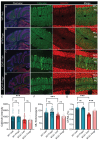
Fingolimod ameliorates the reduced input area of climbing fibers in SCA1 mice. Representative micrographs of the anterior cerebellar cortex with immunofluorescent labeling of VGLUT2 and Calbindin (green) of SCA1 mice (C,D) and WT mice (A,B), sacrificed at 10 weeks of age. Detailed images of calbindin and VGLUT2 are in lobule IV. Analysis of calbindin density (E), molecular layer thickness (F), and climbing fiber coverage of ML (CF/ML%), panel (G). ML = molecular layer; PCL = Purkinje cell layer; GCL = granule cell layer. Scale bars are 500 μm for the overview image on the left and 40 μm for the magnifications. Each experimental group consisted of five mice, and for each mouse, for calbindin intensity analysis, five sections were analyzed. For ML thickness and CF/ML, five sections were analyzed for each mouse, and we included the average value per section. All values are presented as mean ± sem ** p < 0.01 and *** p < 0.001. All data were tested for significance using a two-way ANOVA or mixed-model test; only the outcomes for WT-Veh vs. SCA1-Veh, WT-Veh vs. WT-Fingo and SCA1-Veh vs. SCA1-Fingo are indicated, ns—not significant.
Figure 4
Figure 4
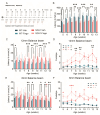
Delaying the start of treatment with fingolimod has bidirectional effects on behavioral impairment in SCA1 mice. (A) ATXN1[82Q] mutant and littermate control mice were injected with fingolimod or vehicle solution three times a week, starting from 5 weeks of age, and behavioral experiments began at 5 weeks. We analyzed rotarod performance (B), 12 mm balance beam latency to cross (C), the number of foot slips (D), the 6 mm balance beam latency to cross (E), and the number of foot slips (F). All experimental groups consisted of 12 mice. The non-normally distributed rotarod results were analyzed using a mixed-effects model to compare WT-Veh with SCA1-Veh and SCA1-Veh with SCA1-Fingo. For normally distributed data—crossing latency on 12 mm BB, foot slips on 12 mm BB, crossing latency on 6 mm BB, and foot slips on 6 mm BB—a two-way ANOVA was used to assess the effect of genotype and treatment between WT-Veh vs. SCA1-Veh, WT-Veh vs. WT-Fingo and SCA1-Veh vs. SCA1-Fingo. All values are presented as mean ± sem.* p < 0.05, ** p < 0.01 and *** p < 0.001; only the outcomes for WT-Veh vs. SCA1-Veh, WT-Veh vs. WT-Fingo and SCA1-Veh vs. SCA1-Fingo are indicated, ns—not significant.
Figure 5
Figure 5
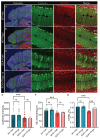
Long-term use of fingolimod reduces GFAP expression and the number of microglia in SCA1 mice. Overview micrographs of GFAP and Iba1 immunofluorescent labeling of the posterior cerebellum of SCA1 mice (C,D) and control littermate mice (A,B) at week 13. Higher-resolution confocal in the overview images shows GFAP and Iba1 staining in lobule IV. (E) Analysis of the standard deviation of the intensity of GFAP labeling measured across the cerebellar cortex. (F) Analysis of Iba1 intensity in the same sections. (G) Analysis of the number of microglia in the anterior cerebellum. Each experimental group consisted of five mice, and five sections were analyzed for each mouse. ML = molecular layer; PCL = Purkinje cell layer; GCL = granule cell layer. Scale bars are 500 μm for the overview image on the left and 40 μm for the magnifications. All values are presented as mean ± sem and a two-way ANOVA was used to test for significance. * p < 0.05, ** p < 0.01 and *** p < 0.001; only the outcomes for WT-Veh vs. SCA1-Veh, WT-Veh vs. WT-Fingo and SCA1-Veh vs. SCA1-Fingo are indicated, ns—not significant.
Figure 6
Figure 6
Fingolimod increases the input of climbing fibers in SCA1 mice in the later disease stage. Representative micrographs of PCs and expression in the posterior cerebellum of SCA1 mice (C,D) and WT mice (A,B) at week 13 (scale bar = 200 μm). Detailed images of calbindin and VGLUT2 in SCA1 mice and WT mice in lobule VII at week 13 (scale bar = 50 μm). ML = molecular layer; PCL = Purkinje cell layer; GCL = granule cell layer. Four mice were in each group. Analysis of calbindin density (E), molecular layer thickness (F), and CF/ML% (G). ML = molecular layer; PCL = Purkinje cell layer; GCL = granule cell layer. Scale bars are 500 μm for the overview image on the left and 40 μm for the magnifications. Each experimental group consisted of five mice. For calbindin intensity analysis, five sections were analyzed. For ML thickness and CF/ML, five sections were analyzed in each mouse, and we calculated the average value. All values are presented as mean ± sem and a two-way ANOVA was used to test for significance. *** p < 0.001; only the outcomes for WT-Veh vs. SCA1-Veh, WT-Veh vs. WT-Fingo and SCA1-Veh vs. SCA1-Fingo are indicated, ns—not significant.
Figure 7
Figure 7
Short-term fingolimod administration minimally improves behavioral deficits in SCA1 mice in later stages of disease development. (A) ATXN1[82Q] mutant and littermate control mice were injected with fingolimod or vehicle solution three times a week for four weeks, starting from 10 weeks of age, combined with behavioral experiments. Rotarod (B), 12 mm balance beam latency (C) and number of foot slips (D), and 6 mm balance beam latency to cross (E) and number of foot slips (F). All experimental groups consisted of 12 mice per group. Rotarod and latency of 12 mm BB were not normally distributed and therefore were analyzed using a mixed-effects model to compare WT-Veh with SCA1-Veh and SCA1-Veh with SCA1-Fingo. For normal distribution data, foot slips on the 12 mm BB, crossing latency on the 6 mm BB, and foot slips on the 6 mm BB, a two-way ANOVA was used to assess the effect of genotype and treatment. All values are presented as mean ± sem.* p < 0.05, ** p < 0.01 and *** p < 0.001; only the outcomes for WT-Veh vs. SCA1-Veh, WT-Veh vs. WT-Fingo and SCA1-Veh vs. SCA1-Fingo are indicated, ns—not significant.
Figure 8
Figure 8
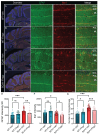
Short-term use of fingolimod is sufficient to reduce the immune responses in SCA1 mice. Overview micrographs of GFAP and Iba1 expression in the posterior cerebellum of SCA1 mice (C,D) and WT mice (A,B) at week 13 (scale bar = 500 μm). Detailed confocal images of GFAP and Iba1 in lobule IV in SCA1 mice and WT mice at week 13 (scale bar = 40 μm). Analysis of GFAP intensity variance (E), Iba1 intensity (F), and microglia count in the anterior cerebellum (G). ML = molecular layer; PCL = Purkinje cell layer; GCL = granule cell layer. Each group consists of five mice, and five sections were chosen to be analyzed. All values are presented as mean ± sem.* p < 0.05, and *** p < 0.001; two-way ANOVA was used and only the outcomes for WT-Veh vs. SCA1-Veh, WT-Veh vs. WT-Fingo and SCA1-Veh vs. SCA1-Fingo are indicated, ns—not significant.
Figure 9
Figure 9
Short-term fingolimod treatment ameliorates the reduced input of climbing fibers in SCA1 mice. Representative micrographs of PC and expression in the posterior cerebellum of SCA1 mice (C,D) and WT mice (A,B) at week 13 (scale bar = 500 μm). Detailed images of calbindin, VGLUT2 in lobule IV of SCA1 mice and WT mice at week 13 (scale bar = 40 μm). Analysis of calbindin density (E), molecular layer thickness (F), and CF/ML% (G). ML = molecular layer; PCL = Purkinje cell layer; GCL = granule cell layer. Each group consists of five mice. For calbindin intensity analysis, five sections were analyzed; for ML thickness and CF/ML, five sections were analyzed from each mouse, and we calculated the average value. All values are presented as mean ± sem and a two-way ANOVA was used to test for significance. *** p < 0.001; only the outcomes for WT-Veh vs. SCA1-Veh, WT-Veh vs. WT-Fingo and SCA1-Veh vs. SCA1-Fingo are indicated, ns—not significant.

References

    1. Klockgether T., Mariotti C., Paulson H.L. Spinocerebellar Ataxia. Nat. Rev. Dis. Prim. 2019;5:24. doi: 10.1038/s41572-019-0074-3. - DOI - PubMed
    1. Horber V., Andersen G.L., Arnaud C., De La Cruz J., Dakovic I., Greitane A., Hensey O., Himmelmann K., Hollody K., Horridge K., et al. Prevalence, Clinical Features, Neuroimaging, and Genetic Findings in Children with Ataxic Cerebral Palsy in Europe. Neurology. 2023;101:e2509–e2521. doi: 10.1212/WNL.0000000000207851. - DOI - PMC - PubMed
    1. Tejwani L., Lim J. Pathogenic Mechanisms Underlying Spinocerebellar Ataxia Type 1. Cell. Mol. Life Sci. 2020;77:4015–4029. doi: 10.1007/s00018-020-03520-z. - DOI - PMC - PubMed
    1. Kim J.H., Lukowicz A., Qu W., Johnson A., Cvetanovic M. Astroglia Contribute to the Pathogenesis of Spinocerebellar Ataxia Type 1 (SCA1) in a Biphasic, Stage-of-Disease Specific Manner. Glia. 2018;66:1972–1987. doi: 10.1002/glia.23451. - DOI - PMC - PubMed
    1. Zühlke C., Dalski A., Hellenbroich Y., Bubel S., Schwinger E., Bürk K. Spinocerebellar Ataxia Type 1 (SCA1): Phenotype-Genotype Correlation Studies in Intermediate Alleles. Eur. J. Hum. Genet. 2002;10:204–209. doi: 10.1038/sj.ejhg.5200788. - DOI - PubMed

MeSH terms

LinkOut - more resources