. 2025 May 15;26(10):4721.
doi: 10.3390/ijms26104721.

Proteomic Analysis of Invasive Breast Cancer Cells Treated with CBD Reveals Proteins Associated with the Reversal of Their Epithelial-Mesenchymal Transition Induced by IL-1β

Affiliations

Proteomic Analysis of Invasive Breast Cancer Cells Treated with CBD Reveals Proteins Associated with the Reversal of Their Epithelial-Mesenchymal Transition Induced by IL-1β

Lázaro García-Morales et al. Int J Mol Sci. .

Abstract

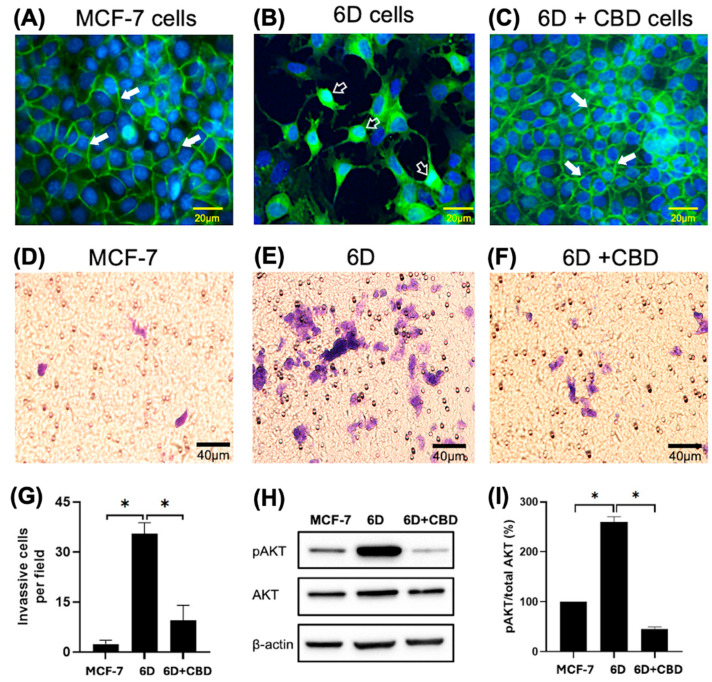
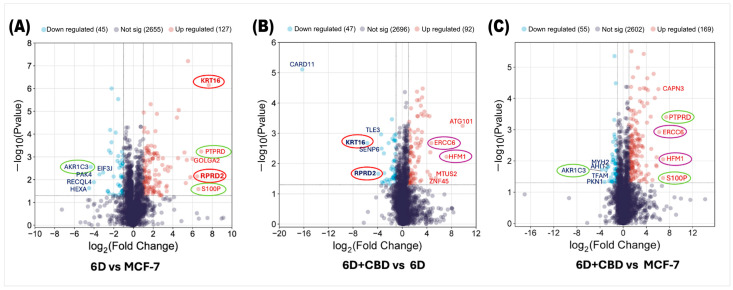
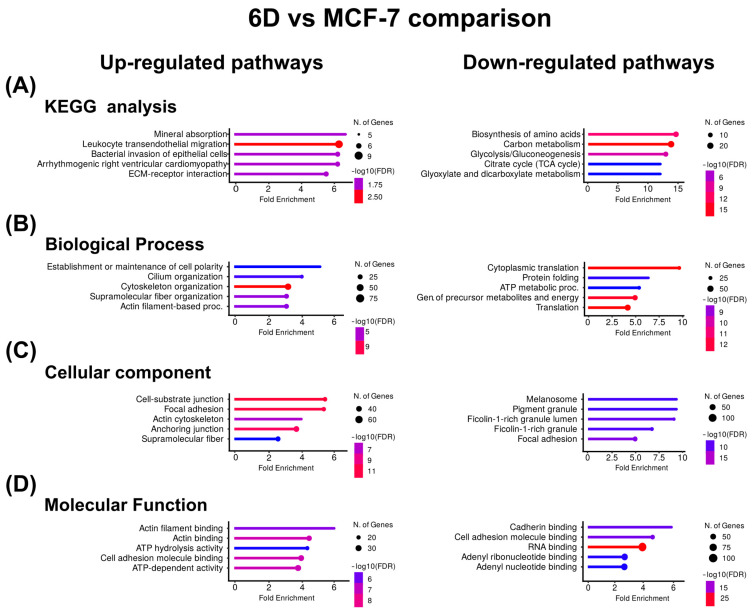
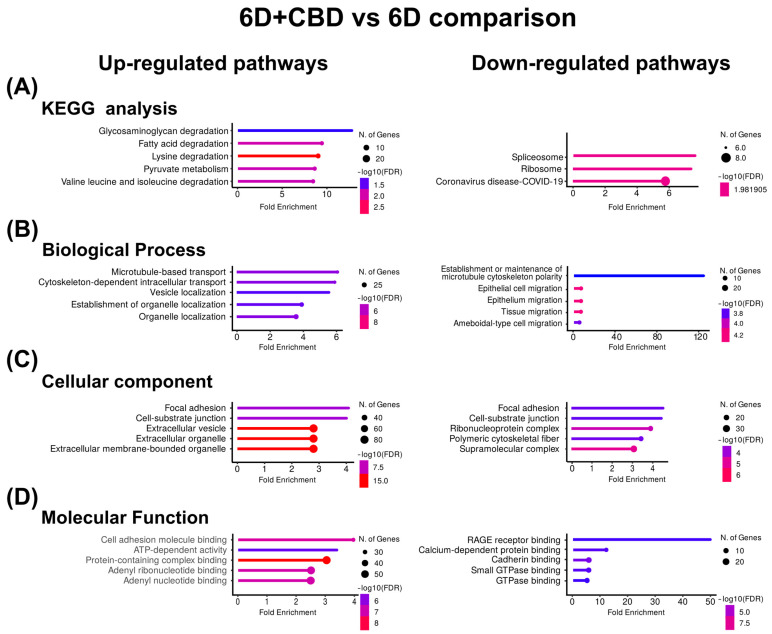
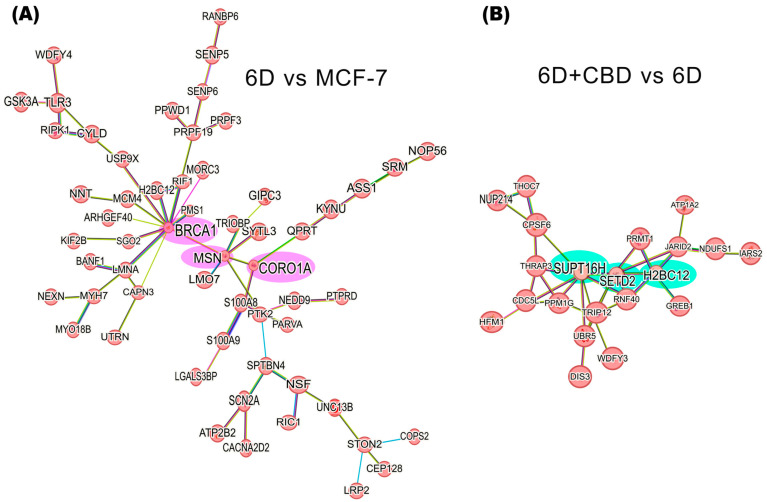
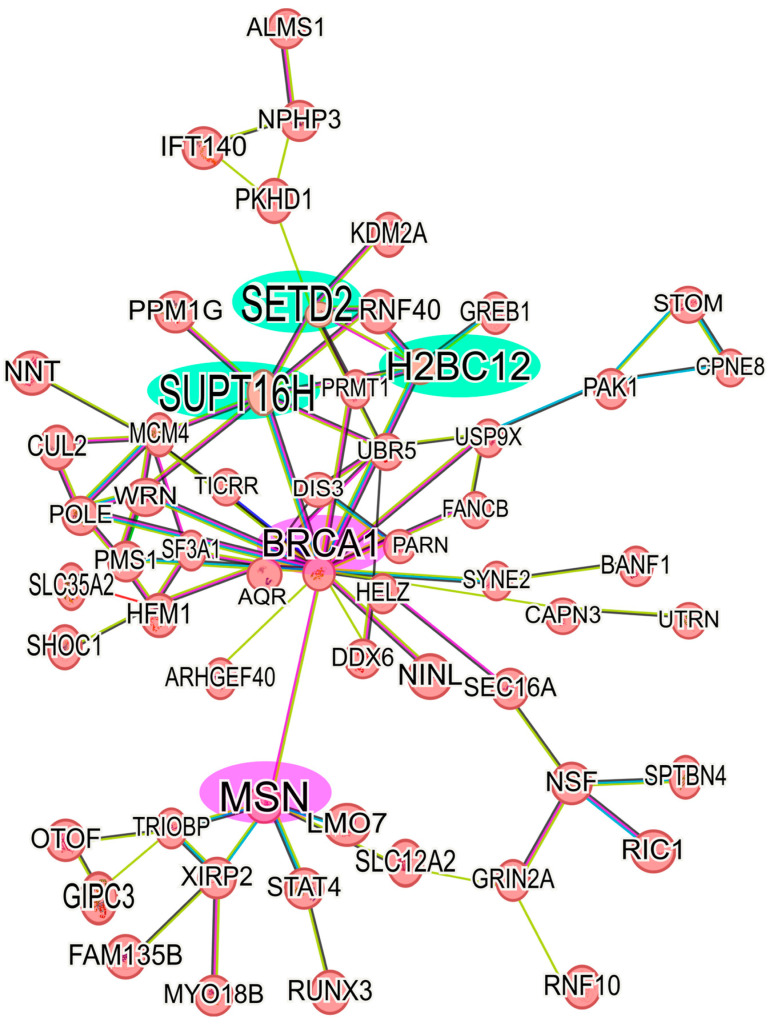
Cannabidiol (CBD) has shown promise in treating cancers with an inflammatory microenvironment. Although it has been demonstrated that IL-1β induces epithelial-mesenchymal transition (EMT) of MCF-7 cells and CBD reverts this process, in restoring the epithelial non-invasive phenotype, there is limited understanding of how this cannabinoid regulates these processes. In this work, MCF-7 cells were induced to adopt an aggressive phenotype (6D cells), which was reversed by CBD. Then, protein expression was analyzed by mass spectrometry to compare 6D vs. MCF-7 cells and 6D+CBD vs. 6D cells proteomes. Novel proteins associated with EMT and CBD signaling were identified. Twenty-four of them were oppositely regulated by IL-1β and CBD, suggesting new points of crosstalk between the IL-1β and CBD signaling pathways. From the data, two protein networks were constructed: one related to EMT with 58 up-regulated proteins and another with 21 related to CBD signaling. The first one showed the proteins BRCA1, MSN, and CORO1A as the key axis that contributes to the establishment of a mesenchymal phenotype. In the CBD signaling, the key axis was formed by SUPT16H, SETD2, and H2BC12, which suggests epigenetic regulation by CBD in the restoration of an epithelial phenotype of breast cancer cells, providing new targets for anticancer therapy.

Keywords: cancer treatment; cannabidiol; mass spectrometry; phenotype reversion; protein networks; protein regulation; proteomics.


Conflict of interest statement

The authors declare no conflicts of interest.

Figures

Figure 1
Figure 1
Changes in cell morphology and β-catenin expression in breast cancer cells induced by IL-1β or CBD stimulation. (A) Representative image of cell morphology and β-catenin distribution in the control MCF-7, (B) 6D, and (C) 6D+CBD cells, β-catenin localization in the adherens junctions (full arrows) or in the nuclei (empty arrows) is indicated in each panel. Bar = 20 µm. (D) Representative image of MCF-7 cell invasion through Matrigel-coated Transwell inserts. (E) 6D and (F) 6D+CBD cells. The cells were stained with Giemsa and examined under a light microscope. Five fields per insert were analyzed (Bar = 40 µm). (G) Number of cells that invaded Matrigel-coated inserts is represented as mean ± SD of the obtained values, asterisks indicate significance at p ≤ 0.05. (H) Representative western blot showing AKT and pAKT (Ser 473) levels in MCF-7, 6D, and 6D+CBD cells. (I) Relative expression of the percentage of AKT phosphorylation (expressed as pAKT/Total AKT ratio) in each cell type, asterisks indicate significance at p ≤ 0.05.
Figure 2
Figure 2
Volcano plots of differential protein expression in the MCF-7, 6D, and 6D+CBD cells obtained by mass spectrometry. (A) Distribution of all differentially expressed proteins in the 6D cells vs. control MCF-7 cells. (B) Differential protein distribution in the 6D+CBD vs. 6D cells. (C) Differential protein distribution in the 6D+CBD vs. control MCF-7 cells. In all graphs, up-regulated proteins (log2FC ≥ 1) are shown as red points and down-regulated (log2FC ≤ −1) ones as blue points, proteins with not-significative changes in the expression are shown as purple points. Data are displayed according to the log2Fold change (horizontal axis) and −log10 of the p-value (vertical axis). The black-dotted line on the vertical axis indicates the limits for significance (−log10Pvalue ≤ 0.05). The top five up-regulated and down-regulated proteins are indicated according to their gene symbols. KRT16 and RPRD2, circled in red, were up-regulated by IL-1β and down-regulated by CBD. PTPRD, S100P, and AKR1C3, circled in green, exhibited similar expression patterns in both, 6D vs. MCF-7 and 6D+CBD vs. MCF-7 comparisons. The CBD up-regulated proteins ERCC6 and HFM1 are indicated with purple circles.
Figure 3
Figure 3
KEGG and Gene Ontology analyses of the proteins with co-expressed patterns identified in the 6D vs. MCF-7 comparison. (A) KEGG pathways identified in the up-regulated and down-regulated proteins. (B) Pathways associated with biological processes. (C) Pathways associated with cellular component. (D) Pathways associated with molecular function. In each case, only the five pathways with the highest enrichment are shown.
Figure 4
Figure 4
KEGG and Gene Ontology analyses of the proteins with co-expressed patterns identified in the 6D+CBD vs. 6D comparison. (A) KEGG pathways identified. (B) Pathways associated with biological processes. (C) Pathways associated with cellular component. (D) Pathways associated with molecular function. In each case, only the five pathways with the highest enrichment are shown.
Figure 5
Figure 5
Protein-protein interaction networks of IL-1β or CBD up-regulated proteins in the malignant 6D cells. (A) The main network of IL-1β up-regulated proteins in the 6D vs. control MCF-7 cells comparison shows a key axis formed by the proteins BRCA1, MSN, and CORO1A (highlighted in pink). (B) The main network of CBD up-regulated proteins in the 6D+CBD vs. 6D comparison shows a key axis formed by the proteins SUPT16H, SETD2, and H2BC12 (highlighted in green). The interaction analyses were performed using STRING, considering only the statistically significant up-regulated proteins (log2FC ≥ 1).
Figure 6
Figure 6
Protein-protein interaction network of up-regulated proteins in 6D+CBD vs. MCF-7 cells. The main network of CBD up-regulated proteins with a log2FC ≥ 1 was formed with 58 proteins. The interaction of the key axis formed by the proteins SUPT16H, SETD2, and H2BC12 (highlighted in green) with BRCA1 and MSN (highlighted in pink) is shown. This interaction analysis was performed using STRING, considering only the statistically significant up-regulated proteins.

Similar articles

References

    1. Ray I., Michael A., Meira L.B., Ellis P.E. The Role of Cytokines in Epithelial–Mesenchymal Transition in Gynaecological Cancers: A Systematic Review. Cells. 2023;12:416. doi: 10.3390/cells12030416. - DOI - PMC - PubMed
    1. Guttilla Reed I. Mechanism and Regulation of Epithelial-Mesenchymal Transition in Cancer. Cell Health Cytoskelet. 2015;7:155. doi: 10.2147/CHC.S73822. - DOI
    1. Perez-Yepez E.A., Ayala-Sumuano J.-T., Lezama R., Meza I. A Novel β-Catenin Signaling Pathway Activated by IL-1β Leads to the Onset of Epithelial-Mesenchymal Transition in Breast Cancer Cells. Cancer Lett. 2014;354:164–171. doi: 10.1016/j.canlet.2014.08.015. - DOI - PubMed
    1. Mendoza-Rodríguez M., Arévalo Romero H., Fuentes-Pananá E.M., Ayala-Sumuano J.-T., Meza I. IL-1β Induces up-Regulation of BIRC3, a Gene Involved in Chemoresistance to Doxorubicin in Breast Cancer Cells. Cancer Lett. 2017;390:39–44. doi: 10.1016/j.canlet.2017.01.005. - DOI - PubMed
    1. Mendoza-Rodríguez M., Ayala-Sumuano J., García-Morales L., Zamudio-Meza H., Pérez-Yepez E., Meza I. IL-1β Inflammatory Cytokine-Induced TP63 Isoform ∆NP63α Signaling Cascade Contributes to Cisplatin Resistance in Human Breast Cancer Cells. Int. J. Mol. Sci. 2019;20:270. doi: 10.3390/ijms20020270. - DOI - PMC - PubMed

MeSH terms