. 2025 May 16;26(10):4793.
doi: 10.3390/ijms26104793.

Chronic Chemogenetic Activation of Astrocytes in the Murine Mesopontine Region Leads to Disturbances in Circadian Activity and Movement

Affiliations

Chronic Chemogenetic Activation of Astrocytes in the Murine Mesopontine Region Leads to Disturbances in Circadian Activity and Movement

Baneen Maamrah et al. Int J Mol Sci. .

Abstract

We have previously shown that neuromodulatory actions on astrocytes can elicit metabotropic glutamate- and N-methyl-D-aspartate receptor-dependent tonic changes in excitability in the mesopontine region. Although in vitro experiments explored robust effects, the in vivo significance of our findings remained unknown. In this project, chronic chemogenetic activation of mesopontine astrocytes and its actions on movement, circadian activity, acoustic startle and spatial memory were tested. The control group of young adult male mice where mesopontine astrocytes expressed only the mCherry fluorescent tag was compared to the group expressing the hM3D(Gq) chemogenetic actuator. Chronic chemogenetic astrocyte activation reduced the amplitude of the acoustic startle reflex and increased the locomotion speed in the resting period. Gait alterations were also demonstrated but no change in the spatial memory was explored. As a potential background of these findings, chronic astrocytic activation decreased the cholinergic neuronal number to 54% and reduced the non-cholinergic neuronal number to 76% of the control. In conclusion, chronic astrocytic activation and the consequential decrease in the neuronal number led to disturbances in movement and circadian activity resembling brainstem-related symptoms of progressive supranuclear palsy, raising the possibility that astrocytic overactivation is involved in the pathogenesis of this disease.

Keywords: acoustic startle; activity cycles; astrocyte; chemogenetics; gait; mesopontine region; pedunculopontine nucleus; spatial memory.


Conflict of interest statement

The authors have declared that no conflicts of interest exist.

Figures

Figure 1
Figure 1
The amplitude of the acoustic startle reflex decreased after chronic astrocyte activation. (A). Representative startle traces repeated with 1 min intervals (S1–S5) and their average before (black) and after CNO treatment (blue) of mCherry-expressing control mice. (B). Representative startle traces of hM3D(Gq)-expressing mice with the same arrangement as on panel (A). (C). Statistical comparison of startle amplitudes after CNO normalized to S1 amplitudes before the treatment (CNO/control ratio) during the five concomitant trials and on average. Red traces: average ± SEM of hM3D(Gq)-expressing mice. Orange dots: individual data. Black traces: average ± SEM of mCherry-expressing mice. Gray dots: individual data. (D). Statistical comparison of absolute startle amplitudes before (hollow columns: average ± SEM, gray dots: individual data) and after CNO treatment (blue columns: average ± SEM, light blue dots: individual data) along the five trials and on average in mCherry-expressing controls. (E). Statistical comparison of absolute startle amplitudes before and after CNO treatment in hM3D(Gq)-expressing mice with the same arrangement as on panel D (n = 8 for the DREADD group and 7 for the control group); * p < 0.05; ** p < 0.01.
Figure 2
Figure 2
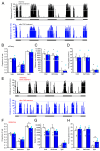
The circadian activity of mice was altered by the mesopontine astrocytic overactivation. (A). Activity pattern of an mCherry-expressing control mouse before (black columns) and after CNO consumption (blue columns). Each bar represents the distance moved in cm in 10 min bins. Horizontal bars below the graph represent light (hollow) and dark (black) environmental conditions. (B). Statistical comparison of the proportions of time spent at rest before (hollow columns: average ± SEM, gray dots: individual data) and after CNO consumption (blue columns: average ± SEM, light blue dots: individual data) in the whole time (“total”), in the active period (“darkness”) and in the resting period (“light”) in the case of the mCherry-expressing control mice. (C). Statistics of the distances moved in a day of mCherry-expressing control mice with similar arrangement as on panel (B). (D). Statistics of the maximal recorded running speed in a day of mCherry-expressing control mice with similar arrangement as on panel (B). (E). Activity pattern of an hM3D(Gq)-expressing mouse in a similar arrangement as on panel (A). (F). Statistical comparison of the proportions of time spent at rest before and after CNO consumption of the hM3D(Gq)-expressing mice. (G). Statistics of the distances moved in a day of the hM3D(Gq)-expressing mice. (H). Statistics of the maximal recorded running speed in a day of the hM3D(Gq)-expressing mice. Panel arrangements are similar to those on panels (B) and (D) (n = 6 for the DREADD group and 6 for the control group); * p < 0.05.
Figure 3
Figure 3
Alterations in the movement pattern after astrocytic overactivation. (A,B). Representative footprint patterns of a hM3D(Gq) mouse before (A) and after CNO treatment (B). Blue: hind paws, red: front paws. (C). Measurement of footprint parameters. (DF). Statistical summary of stride, sway and stance lengths before (hollow columns: average ± SEM, gray dots: individual data) and after CNO treatment (blue columns: average ± SEM, light blue dots: individual data) of mCherry-expressing control mice. (GI). Statistical summary of stride, sway and stance lengths of hM3D(Gq)-expressing mice with a similar arrangement as on (DF) (n = 9 for the DREADD group and 6 for the control group); ** p < 0.01; *** p < 0.001.
Figure 4
Figure 4
The spatial memory was not affected by mesopontine astrocytic overactivation. (A,B). The path of the mouse to the shelter in the Barnes maze test (yellow) before (A) and after training (B). (C). Statistical comparison of the distances run during training trials, after 3 days (“control”), directly after CNO consumption and after a second training series. Red squares: average ± SEM, orange dots: individual data of hM3D(Gq) mice. Black squares: average ± SEM, gray dots: individual data of mCherry-expressing control mice (n = 7 for the DREADD group and 7 for the control group).
Figure 5
Figure 5
Evaluation of the injection sites and chronic changes in neuronal number. (A). Individual coronal sections from 4.26 to 4.96 mm caudal from the bregma by 160 µm. Gray lines: contours of the brainstem, the aqueduct and the periaqueductal gray. Red contours: pedunculopontine nucleus. Colored areas: individual places of bilateral mCherry expression from all experiments. Scale bar: 1 mm. (B). Merged image of six coronal mesencephalic sections on panel (A). Scale bar: 1 mm. (C). Colocalization of GFAP immunohistochemical labeling and mCherry expression on a single 1 µm thick z-stack image (left, green: GFAP immunopositivity, middle, red: mCherry expression, right: merged image). Scale bar: 20 µm. (D). The lack of colocalization in NeuN labeling and mCherry expression on a single z-stack image (left, blue: NeuN labeling, middle, red: mCherry expression, right: merged image). Scale bar: 20 µm. (E). Cholinergic and non-cholinergic neuronal numbers after chronic CNO treatment and behavioral tests in mCherry-expressing control mice on a single z-stack image (from left to right: blue: NeuN labeling, red: mCherry expression, green: ChAT immunohistochemistry, merged). Scale bar: 50 µm. (F). Cholinergic and non-cholinergic neuronal numbers after the same chronic CNO treatment and behavioral tests in hM3D(Gq)- and mCherry-expressing DREADD mice on a single z-stack image (from left to right: blue: NeuN labeling, red: mCherry expression, green: ChAT immunohistochemistry, merged). Scale bar: 50 µm. (G). Statistical comparison of the injection sites caudal from the bregma in mm in the case of control mice (mCherry, black columns: average ± SEM; gray dots: individual data) and DREADD mice (hM3D(Gq), red columns: average ± SEM; orange dots: individual data). (H). Statistical comparison of cholinergic neuronal numbers after CNO treatment in control mice (mCherry, light green columns) and in DREADD mice (hM3D(Gq), green columns); non-cholinergic neuronal numbers (control: light blue, DREADD: blue) and astrocytes (control: pink, DREADD: red). Columns represent average ± SEM, gray dots indicate the individual data points (n = 8 for the DREADD group and 6 for the control group); ** p < 0.01.
Figure 6
Figure 6
The experimental design and the timing of the operation, treatment and behavioral tests.

Similar articles

References

    1. Ryczko D., Dubuc R. The multifunctional mesencephalic locomotor region. Curr. Pharm. Des. 2013;19:4448–4470. doi: 10.2174/1381612811319240011. - DOI - PubMed
    1. Ryczko D., Dubuc R. Dopamine and the brainstem locomotor networks: From lamprey to human. Front. Neurosci. 2017;11:295. doi: 10.3389/fnins.2017.00295. - DOI - PMC - PubMed
    1. Koch M., Kungel M., Herbert H. Cholinergic neurons in the pedunculopontine tegmental nucleus are involved in the mediation of prepulse inhibition of the acoustic startle response in the rat. Exp. Brain Res. 1993;97:71–82. doi: 10.1007/BF00228818. - DOI - PubMed
    1. Alam M., Schwabe K., Krauss J.K. The pedunculopontine nucleus area: Critical evaluation of interspecies differences relevant for its use as a target for deep brain stimulation. Brain. 2011;134:11–23. doi: 10.1093/brain/awq322. - DOI - PubMed
    1. Noga B., Sanchez F., Villamil L., O’Toole C., Kasicki S., Olszewski M., Cabaj A.M., Majczyński H., Sławińska U., Jordan L.M. LFP oscillations in the mesencephalic locomotor region during voluntary locomotion. Front. Neural Circuit. 2017;11:34. doi: 10.3389/fncir.2017.00034. - DOI - PMC - PubMed

LinkOut - more resources