. 2025 May 19;26(10):4841.
doi: 10.3390/ijms26104841.

Single-Cell Transcriptomic Profiling Reveals Regional Differences in the Prefrontal and Entorhinal Cortex of Alzheimer's Disease Brain

Affiliations

Single-Cell Transcriptomic Profiling Reveals Regional Differences in the Prefrontal and Entorhinal Cortex of Alzheimer's Disease Brain

Rui-Ze Niu et al. Int J Mol Sci. .

Abstract

Previous studies have largely overlooked cellular differential alterations across differentially affected brain regions in both disease mechanisms and therapeutic development of Alzheimer's disease (AD). This study aimed to compare the differential cellular and transcriptional changes in the prefrontal cortex (PFC) and entorhinal cortex (EC) of AD patients through an integrated single-cell transcriptomic analysis. We integrated three single-cell RNA sequencing (scRNA-seq) datasets comprising PFC and EC samples from AD patients and age-matched healthy controls. A total of 124,658 nuclei and 31 cell clusters were obtained and classified into eight major cell types, with EC exhibiting much more pronounced transcriptional alterations than PFC. Through network analysis, we pinpointed hub regulatory genes that form interconnected networks driving AD pathogenesis, findings validated by RT-qPCR showing more pronounced expression changes in EC versus PFC of AD mice. Moreover, dysregulation of the LINC01099-associated regulatory networks in the PFC and EC, showing correlation with AD progression, may present new therapeutic targets for AD. Together, these results suggest that effective AD biomarkers and therapeutic strategies may require simultaneous, precise targeting of specific cell populations across multiple brain regions.

Keywords: Alzheimer’s disease; cellular regulatory network; entorhinal cortex; prefrontal cortex; single-cell transcriptome sequencing.


Conflict of interest statement

The authors declare no conflicts of interest.

Figures

Figure 1
Figure 1
snRNA-seq analysis of PFC and EC in AD patients. (A) UMAP plot showing 31 cell clusters obtained after data integration cluster analysis for four groups. (B) UMAP plot of the major cell types. (C) Dot plot displays the expression of marker genes for each cell type. (C) The number of individual cell types in the 124,658 samples. (D) The number of individual cell types in PFC_AD, EC_AD, PFC_Ct, and EC_Ct groups. (E) Population percentage of eight cell types among different groups. (F) Gene set score analysis for eight cell types using human brain aging signatures. (G) Gene set score analysis for PFC_AD, EC_AD, PFC_Ct, and EC_Ct groups using human brain aging signatures. (H) Gene set score analysis for ExN and InN in different groups using senescence-associated secretory phenotype signature. Two-sided Wilcoxon rank-sum test, FDR < 0.01, log2 (mean gene expression in AD/mean gene expression in control) > 0.25. Color-coded scale bar of gene expression indicates z-scores after normalizing to all the cell types. Oligo: oligodendrocytes; ExN: excitatory neurons; OPC: oligodendrocyte precursor cells; Astro: astrocytes; Micro: microglia; InN: inhibitory neurons; Endo: endothelial cells; Ct: control; PFC: prefrontal cortex; EC: entorhinal cortex.
Figure 2
Figure 2
GSEA analysis of DEGs in Astro and Micro. (A) Venny plots showing the number of Astro DEGs in PFC and EC of AD patients. (B) The overlapping Astro DEGs between PFC and EC regions. (C) GO enrichment analysis of Astro DEGs. (D) PPI analysis of genes jointly differentially expressed in Astro. (E) Venny plots showing the number of Micro DEGs in PFC and EC of AD patients. (F) The overlapping Micro DEGs between PFC and EC regions. (G) GO enrichment analysis of Micro DEGs. (H) PPI analysis of genes jointly differentially expressed in Micro. Two-sided Wilcoxon rank-sum test, FDR < 0.01, log2 (mean gene expression in AD/mean gene expression in control) > 0.25. Color-coded scale bar of gene expression indicates z-scores after normalizing to all the groups.
Figure 3
Figure 3
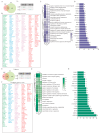
GSEA analysis of DEGs in Oligo and OPC. (A) Venny plots showing the number of Oligo DEGs in PFC and EC of AD patients. (B) The overlapping Oligo DEGs between PFC and EC regions. (C) GO enrichment analysis of Oligo DEGs. (D) Venny plots showing the number of DEGs of OPC in PFC and EC of AD patients. (E) The overlapping OPC DEGs between PFC and EC regions. (F) GO enrichment analysis of DEGs in OPC. Two-sided Wilcoxon rank-sum test, FDR < 0.01, log2 (mean gene expression in AD/mean gene expression in control) > 0.25. Color-coded scale bar of gene expression indicates z-scores after normalizing to all the groups.
Figure 4
Figure 4
GSEA analysis of DEGs in ExN and InN. (A) Venny plots showing the number of DEGs for ExN in PFC and EC of AD patients. (B) The overlapping ExN DEGs between PFC and EC regions. (C) GO enrichment analysis of DEGs in ExN. (D) PPI analysis of genes jointly differentially expressed in ExN. (E) Venny plots showing the number of DEGs for InN in PFC and EC of AD patients. (F) The overlapping InN DEGs between PFC and EC regions. (G) GO enrichment analysis of DEGs in InN. (H) PPI analysis of genes jointly differentially expressed in InN. Two-sided Wilcoxon rank-sum test, FDR < 0.01, log2 (mean gene expression in AD/mean gene expression in control) > 0.25. Color-coded scale bar of gene expression indicates z-scores after normalizing to all the groups.
Figure 5
Figure 5
GSEA analysis of DEGs in endothelial and Unknown cells. (A) Venny plots showing the number of DEGs of Endo in PFC and EC tissues of AD patients. (B) The overlapping Endo DEGs between PFC and EC regions. (C) GO enrichment analysis of DEGs in Endo. (D) PPI analysis of common DEGs of Endo in PFC and EC of AD patients. (E) Venny plots showing the number of DEGs of Unknown cells in PFC and EC of AD patients. (F) The overlapping Unknown cell DEGs between PFC and EC regions. (G) GO enrichment analysis of DEGs in Unknown cells. (H) PPI analysis of common DEGs in Unknown cells. Two-sided Wilcoxon rank-sum test, FDR < 0.01, log2 (mean gene expression in AD/mean gene expression in control) > 0.25. Color-coded scale bar of gene expression indicates z-scores after normalizing to all the groups.
Figure 6
Figure 6
The integrated analysis of bulk RNA-seq and snRNA-seq. (A) The overlapped DEGs of bulk RNA-seq (limma moderated t-statistics, false discovery rate (FDR) < 0.01, FC > 1.5) and snRNA-seq (two-sided Wilcoxon rank-sum test, FDR < 0.01, log2 (mean gene expression in AD/mean gene expression in control) > 0.25). (B) PPI network of key regulatory genes out of the 94 overlapped genes in the eight cell types. The minimum required interaction score is highest confidence (0.900). (C) The expression patterns of key regulatory genes across different brain regions in our integrated human AD snRNA-seq data. (D) The expression patterns of the same gene set in published AD organoid single-cell sequencing data [19]. (EG) GO enrichment analysis of the overlapped genes between bulk RNA-seq data and snRNA-seq data, BP (E), MF (F), and CC (G). (H) Analysis of KEGG signaling on the overlapped genes between bulk RNA-seq data and snRNA-seq data.
Figure 7
Figure 7
Differential expression of key regulated genes in the PFC and EC of WT and AD mice. (AR) The expression levels of 18 hub genes in Figure 6B were determined by RT-qPCR in the PFC and EC of WT and AD mice (three males and three females). Data were presented as mean ± SD, n = 6/group. * p < 0.05, ** p < 0.01, *** p < 0.001. ns, no significance.

Similar articles

References

    1. Kunkle B.W., Grenier-Boley B., Sims R., Bis J.C., Damotte V., Naj A.C., Boland A., Vronskaya M., van der Lee S.J., Amlie-Wolf A., et al. Genetic meta-analysis of diagnosed Alzheimer’s disease identifies new risk loci and implicates Aβ, tau, immunity and lipid processing. Nat. Genet. 2019;51:414–430. doi: 10.1038/s41588-019-0358-2. - DOI - PMC - PubMed
    1. Wingo A.P., Liu Y., Gerasimov E.S., Gockley J., Logsdon B.A., Duong D.M., Dammer E.B., Robins C., Beach T.G., Reiman E.M., et al. Integrating human brain proteomes with genome-wide association data implicates new proteins in Alzheimer’s disease pathogenesis. Nat. Genet. 2021;53:143–146. doi: 10.1038/s41588-020-00773-z. - DOI - PMC - PubMed
    1. Sierksma A., Lu A., Mancuso R., Fattorelli N., Thrupp N., Salta E., Zoco J., Blum D., Buée L., De Strooper B., et al. Novel Alzheimer risk genes determine the microglia response to amyloid-β but not to TAU pathology. EMBO Mol. Med. 2020;12:e10606. doi: 10.15252/emmm.201910606. - DOI - PMC - PubMed
    1. Habib N., McCabe C., Medina S., Varshavsky M., Kitsberg D., Dvir-Szternfeld R., Green G., Dionne D., Nguyen L., Marshall J.L., et al. Disease-associated astrocytes in Alzheimer’s disease and aging. Nat. Neurosci. 2020;23:701–706. doi: 10.1038/s41593-020-0624-8. - DOI - PMC - PubMed
    1. Keren-Shaul H., Spinrad A., Weiner A., Matcovitch-Natan O., Dvir-Szternfeld R., Ulland T.K., David E., Baruch K., Lara-Astaiso D., Toth B., et al. A Unique Microglia Type Associated with Restricting Development of Alzheimer’s Disease. Cell. 2017;169:1276–1290.e1217. doi: 10.1016/j.cell.2017.05.018. - DOI - PubMed

Substances

LinkOut - more resources