. 2025 May 19;26(10):4842.
doi: 10.3390/ijms26104842.

Preliminary Evaluation of Plasma circ_0009910, circ_0027478, and miR-1236-3p as Diagnostic and Prognostic Biomarkers in Hepatocellular Carcinoma

Affiliations

Preliminary Evaluation of Plasma circ_0009910, circ_0027478, and miR-1236-3p as Diagnostic and Prognostic Biomarkers in Hepatocellular Carcinoma

Mona Samy Awed et al. Int J Mol Sci. .

Abstract

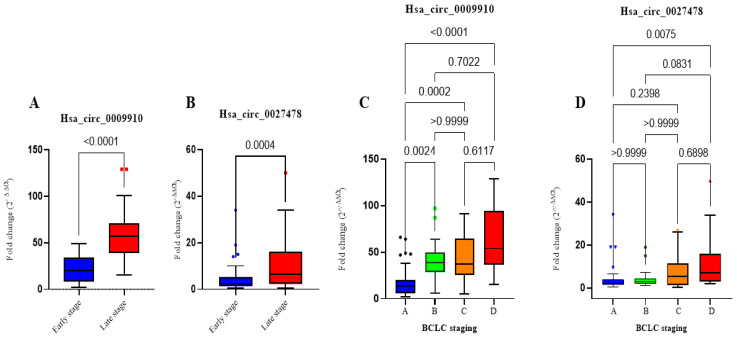
Circular RNAs (circRNAs) are increasingly recognized as significant regulators in multiple cancers, such as hepatocellular carcinoma (HCC), frequently affecting microRNA (miRNA) expression. The diagnostic and prognostic roles of circRNAs, specifically circ_0009910 and circ_0027478, in conjunction with miR-1236-3p, in HCC, have not yet been fully investigated. In this pilot study, we assessed the expression levels of circ_0009910, circ_0027478, and miR-1236-3p in plasma samples from 100 patients diagnosed with HCC and 50 healthy controls through reverse transcriptase-quantitative polymerase chain reaction (RT-qPCR). The diagnostic performance was evaluated using receiver operating characteristic (ROC) curve analysis, and correlations with clinicopathological features were examined. Circ_0009910 and circ_0027478 exhibited significant upregulation in patients with HCC (p < 0.05), whereas miR-1236-3p demonstrated downregulation (p < 0.05). Circ_0009910 demonstrated significant diagnostic accuracy (area under the curve [AUC] = 0.90), effectively differentiating HCC from controls and showing a correlation with tumor size, metastasis, and alpha-fetoprotein (AFP) levels (p < 0.05). Both circ_0009910 and circ_0027478 exhibited a positive correlation with clinicopathological features, whereas miR-1236-3p demonstrated an inverse correlation. Logistic regression validated the diagnostic and prognostic capabilities of these biomarkers. The results indicate that circ_0009910, circ_0027478, and miR-1236-3p, in conjunction with AFP three, present a promising diagnostic and prognostic profile for HCC. Additional validation in larger cohorts is required to establish their clinical utility.

Keywords: circRNAs; circ_0009910; circ_0027478; hepatocellular carcinoma (HCC); miR-1236-3; plasma biomarkers.


Conflict of interest statement

The authors disclose no conflicts of interest, including any investment, personal or other relationships with other entities or organizations that may improperly affect the work in this paper or are perceived to affect it.

Figures

Figure 1
Figure 1
Plasma levels of hsa_circ_0009910 and hsa_circ_0027478 in the studied groups. (A) Fold change of plasma circ_0009910 expression levels in patients with early stage of HCC (n = 53) using TNM staging compared with late stage of HCC (n = 47). (B) Fold change of plasma circ_0027478 expression levels in patients with early stage of HCC vs. late stage of HCC. (C) Fold change of plasma expression levels of hsa_circ_0009910 among four subgroups of HCC in relation to the BCLC staging system. (D) Fold change of plasma expression levels of hsa_circ_0027478 among four subgroups of HCC in relation to the BCLC staging system. The data are presented as a box blot, with the box representing the 25–75% percentiles, the line inside the box indicating the median, and the top and lower lines representing 10–90%. A p-value of < 0.05 indicates statistical significance. BCLC staging system: Barcelona Clinic Liver Cancer, HCC: hepatocellular carcinoma, TNM: tumor, node, metastasis staging. p-values < 0.05 are considered significant.
Figure 2
Figure 2
The plasma concentrations of circ_0009910 and circ_0027478 were measured in the populations under investigation. (A) The statistically significant difference in the fold change of plasma circ_0009910 expression levels across patients with varying quantities of tumor lesions. These patients were divided into two groups: single (n = 32) and multiple (n = 68). (B) The differential expression levels of hsa_circ_0027478 demonstrated the ability to distinguish between the two subgroups according to the number of tumor lesions. (C) Fold change of circ_0009910 expression levels in non-metastatic HCC (n = 75) versus metastatic HCC (n = 25). (D) Fold change of circ_0027478 expression levels in non-metastatic HCC vs. metastatic HCC. p-values < 0.05 are considered significant.
Figure 3
Figure 3
Plasma concentrations of hsa_circ_0009910 and hsa_circ_0027478 were evaluated in subgroups depending on cirrhosis and target tumor size. (A) The fold change in plasma hsa_circ_0009910 expression levels may be used to distinguish between all stages of cirrhosis, except stages 2 and 3. In these stages, patients with HCC were grouped into 4 groups based on cirrhosis staging. {0: absence of fibrosis (n = 16); grade 1: the presence of mild fibrosis (n = 39); grade 2: the presence of moderate fibrosis (n = 28); Grade 3: the presence of severe fibrosis or cirrhosis (n = 17)}. (B) The fold change in expression levels of hsa_circ_0027478 may effectively distinguish between stage 0 and stage 3 and between stage 1 and stage 3. (C,D) The statistical significance of the difference in fold change of plasma hsa_circ_0009910 and hsa_circ_0027478 expression levels across patients with different tumor sizes. The patients were categorized into two groups based on their size: those with a size less than 3 (n = 40) and those with a size more than or equal to 3 (n = 60). p-values < 0.05 are considered significant.
Figure 4
Figure 4
AFP plasma levels in the groups under investigation. (A) A statistical significance of p < 0.0001 is shown by data provided as mean ± SE; HCC (n = 100) and 50 matched controls. (B) AFP levels may effectively distinguish different stages of cirrhosis. (C) AFP levels among four subgroups of HCC in relation to the BCLC staging system; BCLC staging system: Barcelona Clinic Liver Cancer; early stage (Stage A and Stage B), late stage (Stage C and Stage D). (D) AFP levels in non-metastatic HCC (n = 75) versus metastatic HCC (n = 25) (p = 0.023). (E) AFP levels in patients with early stage of HCC (n = 49) compared with late stage of HCC (n = 51) according to TNM staging system (p = 0.0013). (F) The statistical significance difference in plasma AFP levels across patients with different tumor sizes (p = 0.0205).
Figure 5
Figure 5
Diagnostic accuracy of the studied parameters. (A) circ_0009910, (B) circ_0027478, (C) miRNA-1236, (D) AFP: alpha-fetoprotein. Using ROC curve analysis. HCC: hepatocellular carcinoma (n = 100); healthy controls (n = 50). AUC: area under the curve. p-values < 0.05 are considered significant.
Figure 6
Figure 6
Combined ROC curves illustrating the diagnostic performance of various biomarker combinations for HCC. Model 1: AFP + circ_0027478; Model 2: AFP + miR-1236-3p; Model 3: circ_0027478 + circ_0009910; Model 4: miR-1236-3p + circ_0009910. The integration of circular RNAs and microRNAs significantly enhanced the diagnostic power of AFP in distinguishing HCC cases from controls.
Figure 7
Figure 7
The prognostic power of the studied parameters. (A) circ_0009910, (B) circ_0027478, (C) miRNA-1236, (D) AFP: alpha-fetoprotein. Using ROC curve analysis, metastasis (n = 25), non-metastasis (n = 75). AUC: area under the curve. p-values < 0.05 are considered significant.
Figure 8
Figure 8
Correlation analysis among plasma markers and their relationship with clinical and laboratory data among patients with HCC. A correlation map based on a blue–red (cold–hot) continuum. The blue tint suggests a correlation around 1, whereas the color red implies a relationship near −1. White denotes a correlation approaching zero. Associations are calculated using the Spearman regression coefficient. AFP: alpha-feto protein; ALT: alanine transaminase; AST: aspartate transaminase; BCLC: staging system—Barcelona Clinic Liver Cancer; TNM: tumor, node, metastasis staging.

Similar articles

References

    1. Chidambaranathan-Reghupaty S., Fisher P.B., Sarkar D. Chapter One—Hepatocellular carcinoma (HCC): Epidemiology, etiology and molecular classification. In: Sarkar D., Fisher P.B., editors. Advances in Cancer Research. Volume 149. Academic Press; Cambridge, MA, USA: 2021. pp. 1–61. - PMC - PubMed
    1. Yang J.D., Heimbach J.K. New advances in the diagnosis and management of hepatocellular carcinoma. BMJ. 2020;371:m3544. doi: 10.1136/bmj.m3544. - DOI - PubMed
    1. Yang C., Zhang H., Zhang L., Zhu A.X., Bernards R., Qin W., Wang C. Evolving therapeutic landscape of advanced hepatocellular carcinoma. Nat. Rev. Gastroenterol. Hepatol. 2023;20:203–222. doi: 10.1038/s41575-022-00704-9. - DOI - PubMed
    1. Rumgay H., Ferlay J., de Martel C., Georges D., Ibrahim A.S., Zheng R., Wei W., Lemmens V.E., Soerjomataram I. Global, regional and national burden of primary liver cancer by subtype. Eur. J. Cancer. 2022;161:108–118. doi: 10.1016/j.ejca.2021.11.023. - DOI - PubMed
    1. Younossi Z.M., Wong G., Anstee Q.M., Henry L. The global burden of liver disease. Clin. Gastroenterol. Hepatol. 2023;21:1978–1991. doi: 10.1016/j.cgh.2023.04.015. - DOI - PubMed

Publication types

LinkOut - more resources