. 2025 May 21;26(10):4938.
doi: 10.3390/ijms26104938.

NAC1/ACOX2 Axis as a Novel Therapeutic Target for Endometriosis-Related Ovarian Neoplasms

Affiliations

NAC1/ACOX2 Axis as a Novel Therapeutic Target for Endometriosis-Related Ovarian Neoplasms

Shahataj Begum Sonia et al. Int J Mol Sci. .

Abstract

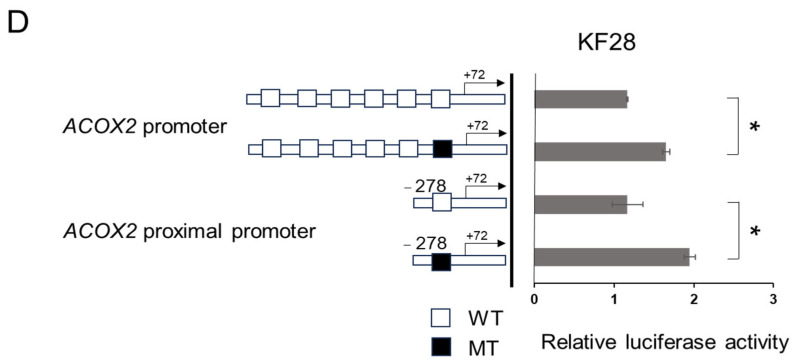
NAC1, a transcription regulator protein associated with cancer, is highly expressed in several tumor types, including ovarian cancer. However, it remains unclear how NAC1 is involved in carcinogenesis. Our previous studies demonstrated that the knockdown of NAC1 in ovarian clear cell carcinoma (OCCC) cell lines induces apoptosis and restores their sensitivity to chemotherapy, suggesting NAC1 as a potential therapeutic target. The present study aimed to identify molecular pathways through which NAC1 is involved in the development of endometriosis-related ovarian neoplasms (ERONs). Immunohistochemistry was performed to clarify the relationship between NAC1 and the potential target protein ACOX2 in surgical specimens of ERONs. Reporter assays were conducted to determine the interaction of NAC1 with the specific cis-element on the ACOX2 promoter. Subsequently, a ChIP assay was performed to investigate the in vivo interaction of NAC1 with the ACOX2 promoter. There was an inverse relationship between NAC1 and ACOX2 expressions in the tumor specimens of ERONs. High NAC1/low ACOX2 expression was found to be a worse prognostic marker for patient survival. Reporter assays demonstrated that NAC1 negatively regulated the ACOX2 promoter via the proximal CATG site. ChIP assays confirmed in vivo binding of NAC1 to the promoter. The present study implicated that NAC1 may contribute to the development of ERONs as a transcriptional repressor by regulating ACOX2 expression via specific binding sites on the promoter, providing a novel insight into the NAC1/ACOX2 axis as a potential therapeutic target of this tumor type.

Keywords: ACOX2; ERON; NAC1; endometriosis; ovarian cancer.


Conflict of interest statement

The authors declare no conflicts of interest.

Figures

Figure 1
Figure 1
Immunohistochemistry of NAC1 and ACOX2 in ERON surgical specimens. Representative cases showing negative (0), weak (1+), moderate (2+), and strong (3+) staining intensities are presented for NAC1 (A) and ACOX2 (B). Images were taken from three different plots for each expression category. The correlation between NAC1 and ACOX2 expression was evaluated via Fisher’s exact test (C).
Figure 1
Figure 1
Immunohistochemistry of NAC1 and ACOX2 in ERON surgical specimens. Representative cases showing negative (0), weak (1+), moderate (2+), and strong (3+) staining intensities are presented for NAC1 (A) and ACOX2 (B). Images were taken from three different plots for each expression category. The correlation between NAC1 and ACOX2 expression was evaluated via Fisher’s exact test (C).
Figure 2
Figure 2
Prognostic significance of NAC1 and ACOX2 expressions in patients with ERONs. Kaplan–Meier survival analyses are shown for high NAC1/low ACOX2 expression in relation to progression-free survival (PFS) (A) and overall survival (OS) (B). M: months.
Figure 3
Figure 3
Pearson’s correlation between NAC1 and ACOX2 expression in OCCC cells. Representative results of Western blot analysis of NAC1 and ACOX2 in each OCCC cell line (A) and their correlation by quantitative evaluation (B) measured by ImageJ software (version 1.53k). The full-length Western blot gel image is available in Supplementary Figure S2.
Figure 4
Figure 4
siRNA-knockdown analysis of NAC1 in OCCC cell lines. Western blotting was used to evaluate NAC1 and ACOX2 protein expressions in OV207 and KF28 OCCC cell lines after siRNA knockdown (A,B). NAC1 knockdown was confirmed in both cell lines (C,D), and efficient knockdown of NAC1 led to significant upregulation of ACOX2 in both cell lines (E,F). The full-length Western blot gel image is available in Supplementary Figure S3.
Figure 5
Figure 5
Transcriptional activity of the ACOX2 promoter in OCCC cell lines with different levels of NAC1 expression. The promoter sequence of the ACOX2 gene spans from −1488 to +72 upstream of the transcriptional start site (arrowhead) (A). The underlines indicate the 6 CATG consensus motifs for NAC1 binding. (B) The luciferase (LUC) reporter construct, in which the ACOX2 full-length promoter was inserted into the pGL3 basic vector, was prepared (B) and applied to the luciferase reporter assays. The transcriptional activity of the ACOX2 promoter was evaluated in each reporter construct using RK3E cells lacking endogenous expression of NAC1 (C) or those with NAC1 overexpression (D). The promoter activity of ACOX2 was further evaluated in OV207 and KF28 cells, both expressing endogenous NAC1 expression (E,F). NAC1 in each cell type was then knocked down by siRNA, and the promoter activity of ACOX2 was also evaluated (G,H). Each experiment was independently repeated three times with three technical replicates. Statistical significance is represented as * p < 0.05; ** p < 0.005.
Figure 5
Figure 5
Transcriptional activity of the ACOX2 promoter in OCCC cell lines with different levels of NAC1 expression. The promoter sequence of the ACOX2 gene spans from −1488 to +72 upstream of the transcriptional start site (arrowhead) (A). The underlines indicate the 6 CATG consensus motifs for NAC1 binding. (B) The luciferase (LUC) reporter construct, in which the ACOX2 full-length promoter was inserted into the pGL3 basic vector, was prepared (B) and applied to the luciferase reporter assays. The transcriptional activity of the ACOX2 promoter was evaluated in each reporter construct using RK3E cells lacking endogenous expression of NAC1 (C) or those with NAC1 overexpression (D). The promoter activity of ACOX2 was further evaluated in OV207 and KF28 cells, both expressing endogenous NAC1 expression (E,F). NAC1 in each cell type was then knocked down by siRNA, and the promoter activity of ACOX2 was also evaluated (G,H). Each experiment was independently repeated three times with three technical replicates. Statistical significance is represented as * p < 0.05; ** p < 0.005.
Figure 6
Figure 6
Promoter assays to identify cis-elements of the ACOX2 promoter responsible for NAC1 repression. (A,B) The full-length or 5′ deleted promoter sequences containing different numbers of CATG sites were prepared and incorporated into the luciferase reporter constructs, followed by luciferase assays using OV207 and KF28 cells. Furthermore, mutant reporter plasmids, in which the most proximal CATG sites were substitution-mutated into the full-length promoter or 5′ deleted promoter containing only this site, were prepared (C,D), followed by luciferase assays using both cell lines. WT: wild type CATG site. MT: substitution mutated CATG site. Each experiment was independently repeated three times with three technical replicates. Statistical significance is represented as * p < 0.05; ** p < 0.005. NS: Not significant.
Figure 6
Figure 6
Promoter assays to identify cis-elements of the ACOX2 promoter responsible for NAC1 repression. (A,B) The full-length or 5′ deleted promoter sequences containing different numbers of CATG sites were prepared and incorporated into the luciferase reporter constructs, followed by luciferase assays using OV207 and KF28 cells. Furthermore, mutant reporter plasmids, in which the most proximal CATG sites were substitution-mutated into the full-length promoter or 5′ deleted promoter containing only this site, were prepared (C,D), followed by luciferase assays using both cell lines. WT: wild type CATG site. MT: substitution mutated CATG site. Each experiment was independently repeated three times with three technical replicates. Statistical significance is represented as * p < 0.05; ** p < 0.005. NS: Not significant.
Figure 7
Figure 7
ChIP analysis to identify the binding of NAC1 to each CATG sequence on the ACOX2 promoter using OV207 and KF28 cells. Primer sets for quantitative PCRs targeting each CATG 1, 2, 3, 4, 5 site generated equivalent levels of immunoprecipitates by the NAC1 antibody compared to those with the control IgG in both cell lines (AE). In contrast, primer sets targeting the most proximal CATG 6 site generated apparently increased levels of immunoprecipitates compared to those with control IgG in both cell lines (F). Normal rabbit IgG (IgG) served as a control antibody, while NAC1 antibody (Ab) was used to detect NAC1 binding. The data are shown as mean values relative to the input, expressed as a percentage (% of input). The error bars indicate the standard deviation, based on three independent measurements (n = 3). Statistical significance is represented as * p < 0.05; ** p < 0.005.
Figure 7
Figure 7
ChIP analysis to identify the binding of NAC1 to each CATG sequence on the ACOX2 promoter using OV207 and KF28 cells. Primer sets for quantitative PCRs targeting each CATG 1, 2, 3, 4, 5 site generated equivalent levels of immunoprecipitates by the NAC1 antibody compared to those with the control IgG in both cell lines (AE). In contrast, primer sets targeting the most proximal CATG 6 site generated apparently increased levels of immunoprecipitates compared to those with control IgG in both cell lines (F). Normal rabbit IgG (IgG) served as a control antibody, while NAC1 antibody (Ab) was used to detect NAC1 binding. The data are shown as mean values relative to the input, expressed as a percentage (% of input). The error bars indicate the standard deviation, based on three independent measurements (n = 3). Statistical significance is represented as * p < 0.05; ** p < 0.005.
Figure 8
Figure 8
Association between NAC1 expression and key fatty acid metabolism-related genes. Gene expression analysis demonstrates a significant reduction in stearoyl-coenzyme A desaturase 1 (SCD1) and fatty acid-binding protein 4 (FABP4) expression in NAC1 siRNA-treated cells compared to control siRNA-treated cells in OV207 and KF28 cell lines (A,B). The error bars indicate the standard deviation, based on three independent measurements (n = 3). Statistical significance is represented as * p < 0.05.
Figure 9
Figure 9
Proposed model for the role of NAC1 in the development of ERONs via the regulation of ACOX2 expression.

Similar articles

References

    1. Siegel R.L., Miller K.D., Jemal A. Cancer statistics. CA Cancer J. Clin. 2016;66:7–30. doi: 10.3322/caac.21332. - DOI - PubMed
    1. Momenimovahed Z., Ghoncheh M., Pakzad R., Hasanpour H., Salehiniya H. Incidence and mortality of uterine cancer and relationship with Human Development Index in the world. Cukurova Med. J. 2017;42:233–240. doi: 10.17826/cutf.322865. - DOI
    1. Wingo P.A., Tong T., Bolden S. Cancer statistics. CA Cancer J. Clin. 1995;45:8–30. doi: 10.3322/canjclin.45.1.8. - DOI - PubMed
    1. Shih I.-M., Kurman R.J. Ovarian tumorigenesis: A proposed model based on morphological and molecular genetic analysis. Am. J. Pathol. 2004;164:1511–1518. doi: 10.1016/S0002-9440(10)63708-X. - DOI - PMC - PubMed
    1. Maeda D., Chen X., Guan B., Nakagawa S., Yano T., Taketani Y., Fukayama M., Wang T.L., Shih I.-M. Rsf-1 (HBXAP) expression is associated with advanced stage and lymph node metastasis in ovarian clear cell carcinoma. Int. J. Gynecol. Pathol. 2011;30:30–35. doi: 10.1097/PGP.0b013e3181e9a319. - DOI - PMC - PubMed

LinkOut - more resources