. 2025 May 21;26(10):4947.
doi: 10.3390/ijms26104947.

Activation of the NALP3-CASP1-IL-1 β Inflammatory Pathway by Pesticide Exposure in Human Umbilical Vein Endothelial Cells

Affiliations

Activation of the NALP3-CASP1-IL-1 β Inflammatory Pathway by Pesticide Exposure in Human Umbilical Vein Endothelial Cells

Antonella Mazzone et al. Int J Mol Sci. .

Abstract

Barrier function regulation, angiogenic potential, and immune response modulation are only a few of the many roles of the vascular system that nowadays represent one of the main targets for environmental pollutants, in particular, pesticides. We have used human umbilical vein endothelial cells (HUVECs) as an in vitro model to investigate the effects of pesticides on the activation of the NALP3-CASP1-IL-1β inflammatory pathway using real time PCR (RT-PCR) and immunofluorescence investigations, reactive oxygen species (ROS) generation, and morphological alterations with scanning electron microscopy (SEM) analysis. Our findings offer a comprehensive evaluation of the cellular and molecular damage induced by pesticide exposure and show strong inflammasome activation. They indicate that these chemicals may initiate necroptosis and drive prolonged inflammation in endothelial cells. This study provides crucial insights into how pesticides contribute to endothelial dysfunction, highlighting the need for further investigation into their inflammatory and immune-modulatory effects on vascular health.

Keywords: HUVECs; ROS; RT-PCR; SEM; immunofluorescence; inflammatory pathway; pesticides.


Conflict of interest statement

The authors declare no conflict of interest.

Figures

Figure 1
Figure 1
Statistical analysis from the MTS assay show cellular metabolic activity of HUVECs without treatment (ctrl) compared with HUVECs exposed at Boscalid (b), Pyraclostrobin (py), Propamocarb (pr), Lamba-cyhalothrin (lc), Boscalid + Pyraclostrobin (b + py), Propamocarb + Lamba-cyhalothrin (pr + lc), Boscalid + Pyraclostrobin + Propamocarb (b + py + pr), and Boscalid + Pyraclostrobin + Lamba-cyhalothrin (b + py + lc) at different time points: 24 h (A), 72 h (B), and 10 days (C). Data are expressed as mean ± standard deviation (n = 3). Significant differences are indicated (* p < 0.05, *** p < 0.001). The experiment was conducted three times, each independently.
Figure 2
Figure 2
The results of the Trypan Blue exclusion test show the cell growth curve of untreated HUVECs (ctrl) and HUVECs treated with Boscalid (b), Pyraclostrobin (py), Propamocarb (pr), Lamba-cyhalothrin (lc), Boscalid + Pyraclostrobin (b + py), Propamocarb + Lamba-cyhalothrin (pr + lc), Boscalid + Pyraclostrobin + Propamocarb (b + py + pr), and Boscalid + Pyraclostrobin + Lamba-cyhalothrin (b + py + lc) at 24 h, 72 h and 10 days.
Figure 3
Figure 3
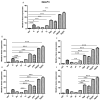
The bar graph shows the statistical analysis, where data are expressed as mean ± standard deviation (SD) from three independent experiments evidencing mRNA levels of NALP3 between ctrl cells (A) and each single pesticide b (B), py (C), pr (D), lc (E) with the other experimental points. Statistical significance was determined using one-way ANOVA followed by Tukey’s multiple comparison test. Significant differences compared to the control are indicated (* p < 0.05, ** p < 0.01, *** p < 0.001).
Figure 4
Figure 4
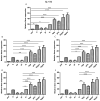
The bar graph shows the statistical analysis, where data are expressed as mean ± standard deviation (SD) from three independent experiments evidencing mRNA levels of CASP1 between ctrl cells (A) and each single pesticide b (B), py (C), pr (D), lc (E) with the other experimental points. Statistical significance was determined using one-way ANOVA followed by Tukey’s multiple comparison test. Significant differences compared to the control are indicated (** p < 0.01, *** p < 0.001). The experiment was conducted in triplicate.
Figure 5
Figure 5
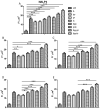
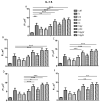
The bar graph shows the statistical analysis, where data are expressed as mean ± standard deviation (SD) from three independent experiments evidencing mRNA levels of IL-1β between ctrl cells (A) and each single pesticide b (B), py (C), pr (D), lc (E) with the other experimental points. Statistical significance was determined using one-way ANOVA followed by Tukey’s multiple comparison test. Significant differences compared to the control are indicated (* p < 0.05, ** p < 0.01, *** p < 0.001).
Figure 6
Figure 6
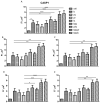
The bar graph shows the statistical analysis, where data are expressed as mean ± standard deviation (SD) from three independent experiments evidencing mRNA levels of IL-6 between ctrl cells (A) and each single pesticide b (B), py (C), pr (D), lc (E) with the other experimental points. Statistical significance was determined using one-way ANOVA followed by Tukey’s multiple comparison test. Significant differences compared to the control are indicated (* p < 0.05, ** p < 0.01, *** p < 0.001).
Figure 7
Figure 7
The bar graph shows the statistical analysis, where data are expressed as mean ± standard deviation (SD) from three independent experiments evidencing mRNA levels of TNF between ctrl cells (A) and each single pesticide b (B), py (C), pr (D), lc (E) with the other experimental points. Statistical significance was determined using one-way ANOVA followed by Tukey’s multiple comparison test. Significant differences compared to the control are indicated (* p < 0.05, ** p < 0.01, *** p < 0.001).
Figure 8
Figure 8
The bar graph shows the statistical analysis, where data are expressed as mean ± standard deviation (SD) from three independent experiments evidencing mRNA levels of CCL2 between ctrl cells (A) and each single pesticide b (B), py (C), pr (D), lc (E) with the other experimental points. Statistical significance was determined using one-way ANOVA followed by Tukey’s multiple comparison test. Significant differences compared to the control are indicated (* p < 0.05, ** p < 0.01, *** p < 0.001).
Figure 9
Figure 9
The figure shows the expression of NALP3 analyzed by immunofluorescence microscopy performed in HUVEC cells cultured alone (A1), with Boscalid (A2), Pyraclostrobin (A3), Propamocarb (A4), Lamba-cyhalothrin (A5), Boscalid + Pyraclostrobin (A6), Propamocarb + Lamba-cyhalothrin (A7), Boscalid + Pyraclostrobin + Propamocarb (A8), and Boscalid + Pyraclostrobin + Lamba-cyhalothrin (A9) over a period of 10 days. The experiment was conducted three times, each independently.
Figure 10
Figure 10
The figures show the expression of CASP1 analyzed by immunofluorescence microscopy performed in HUVEC cells cultured alone (A1), with Boscalid (A2), Pyraclostrobin (A3), Propamocarb (A4), Lamba-cyhalothrin (A5), Boscalid + Pyraclostrobin (A6), Propamocarb + Lamba-cyhalothrin (A7), Boscalid + Pyraclostrobin + Propamocarb (A8), and Boscalid + Pyraclostrobin + Lamba-cyhalothrin (A9) over a period of 10 days. The experiment was conducted three times, each independently.
Figure 11
Figure 11
The figure shows the expression of IL-1β analyzed by immunofluorescence microscopy performed in HUVEC cells cultured alone (A1), with Boscalid (A2), Pyraclostrobin (A3), Propamocarb (A4), Lamba-cyhalothrin (A5), Boscalid + Pyraclostrobin (A6), Propamocarb + Lamba-cyhalothrin (A7), Boscalid + Pyraclostrobin + Propamocarb (A8), and Boscalid + Pyraclostrobin + Lamba-cyhalothrin (A9) over a period of 10 days. The experiment was conducted three times, each independently.
Figure 12
Figure 12
The bar graph shows the statistical analysis, where data are expressed as mean ± standard deviation (SD) from three independent experiments evidencing the NALP3 fluorescence intensity between ctrl cells (A) and each single pesticide b (B), py (C), pr (D), lc (E) with the other experimental points. Statistical significance was determined using one-way ANOVA followed by Tukey’s multiple comparison test. Significant differences compared to the control are indicated (*p < 0.05, ** p < 0.01, *** p < 0.001).
Figure 13
Figure 13
The bar graph shows the statistical analysis, where data are expressed as mean ± standard deviation (SD) from three independent experiments evidencing the CASP1 fluorescence intensity between ctrl cells (A) and each single pesticide b (B), py (C), pr (D), lc (E) with the other experimental points. Statistical significance was determined using one-way ANOVA followed by Tukey’s multiple comparison test. Significant differences compared to the control are indicated (* p < 0.05, ** p < 0.01, *** p < 0.001).
Figure 14
Figure 14
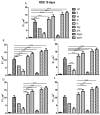
The bar graph shows the statistical analysis, where data are expressed as mean ± standard deviation (SD) from three independent experiments, evidencing IL-1β fluorescence quantification between ctrl cells (A) and each single pesticide b (B), py (C), pr (D), lc (E) with the other experimental points. Statistical significance was determined using one-way ANOVA followed by Tukey’s multiple comparison test. Significant differences compared to the control are indicated (* p < 0.05, ** p < 0.01, *** p < 0.001).
Figure 15
Figure 15
The figure shows ROS measurements from live cells filled with DCFH-DA and captured using confocal microscopy. In particular, the pictures show HUVECs cultured in different conditions: alone (A1), with Boscalid (A2), with Pyraclostrobin (A3), with Propamocarb (A4), with Lambda-cyhalothrin (A5), with Boscalid + Pyraclostrobin (A6), with Propamocarb + Lambda-cyhalothrin (A7), with Boscalid + Pyraclostrobin + Propamocarb (A8), and with Boscalid + Pyraclostrobin + Lambda-cyhalothrin (A9). The scale bar measures 20 micrometers. The experiment was conducted in triplicate.
Figure 16
Figure 16
The bar graph shows the statistical analysis, where data are expressed as mean ± standard deviation (SD) from three independent experiments, evidencing the production of ROS levels between ctrl cells (A) and each single pesticide b (B), py (C), pr (D), lc (E) with the other experimental points. Statistical significance was determined using one-way ANOVA followed by Tukey’s multiple comparison test. Significant differences compared to the control are indicated (** p < 0.01, *** p < 0.001).
Figure 17
Figure 17
SEM pictures show morphological analysis in HUVEC control (A) compared with HUVECs exposed to b (B), py (C), pr (D), lc (E), b + py (F), pr + lc (G), b + py + pr (H), b + py + lc (I) after 10 days of treatment. The experiment was conducted three times.

References

    1. Ahmad M.F., Ahmad F.A., Alsayegh A.A., Zeyaullah M., Alshahrani A.M., Muzammil K., Saati A.A., Wahab S., Elbendary E.Y., Kambal N., et al. Pesticides impacts on human health and the environment with their mechanisms of action and possible countermeasures. Heliyon. 2024;10:e29128. doi: 10.1016/j.heliyon.2024.e29128. - DOI - PMC - PubMed
    1. Boobis A.R., Ossendorp B.C., Banasiak U., Hamey P.Y., Sebestyen I., Moretto A. Cumulative risk assessment of pesticide residues in food. Toxicol. Lett. 2008;180:137–150. doi: 10.1016/j.toxlet.2008.06.004. - DOI - PubMed
    1. Zhang H., Zhang J., Streisand J.B. Oral mucosal drug delivery: Clinical pharmacokinetics and therapeutic applications. Clin. Pharmacokinet. 2002;41:661–680. doi: 10.2165/00003088-200241090-00003. - DOI - PubMed
    1. Goswami T., Jasti B., Li X. Sublingual drug delivery. Crit. Rev. Ther. Drug Carr. Syst. 2008;25:449–484. doi: 10.1615/CritRevTherDrugCarrierSyst.v25.i5.20. - DOI - PubMed
    1. Jaffe E.A., Nachman R.L., Becker C.G., Minick C.R. Culture of human endothelial cells derived from umbilical veins. Identification by morphologic and immunologic criteria. J. Clin. Investig. 1973;52:2745–2756. doi: 10.1172/JCI107470. - DOI - PMC - PubMed

MeSH terms

LinkOut - more resources