Discovery, Biological Evaluation and Binding Mode Investigation of Novel Butyrylcholinesterase Inhibitors Through Hybrid Virtual Screening
- PMID: 40430266
- PMCID: PMC12113681
- DOI: 10.3390/molecules30102093
Discovery, Biological Evaluation and Binding Mode Investigation of Novel Butyrylcholinesterase Inhibitors Through Hybrid Virtual Screening
Abstract
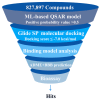
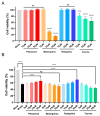
Butyrylcholinesterase (BChE), plays a critical role in alleviating the symptoms of Alzheimer's disease (AD) by regulating acetylcholine levels, emerging as an attractive target for AD treatment. This study employed a quantitative structure-activity relationship (QSAR) model based on ECFP4 molecular fingerprints with several machine learning algorithms (XGBoost, RF, SVM, KNN), among which the XGBoost model showed the best performance (AUC = 0.9740). A hybrid strategy integrating ligand- and structure-based virtual screening identified 12 hits from the Topscience core database, three of which were identified for the first time. Among them, piboserod and Rotigotine demonstrated the best BChE inhibitory potency (IC50 = 15.33 μM and 12.76 μM, respectively) and exhibited favorable safety profiles as well as neuroprotective effects in vitro. Notably, Rotigotine, a marketed drug, was newly recognized for its anti-AD potential, with further enzyme kinetic analyses revealing that it acts as a mixed-type inhibitor in a non-competitive mode. Fluorescence spectroscopy, molecular docking, and molecular dynamics simulations further clarified their binding modes and stability. This study provides an innovative screening strategy for the discovery of BChE inhibitors, which not only identifies promising drug candidates for the treatment of AD but also demonstrates the potential of machine learning in drug discovery.
Keywords: binding mode analysis; biological evaluation; butyrylcholinesterase inhibitors; machine learning; molecular docking; molecule dynamics simulations; virtual screening.
Conflict of interest statement
The authors declare no conflicts of interest.
Figures


Similar articles
-
Discovery, biological evaluation and molecular dynamic simulations of butyrylcholinesterase inhibitors through structure-based pharmacophore virtual screening.Future Med Chem. 2021 May;13(9):769-784. doi: 10.4155/fmc-2020-0325. Epub 2021 Mar 24. Future Med Chem. 2021. PMID: 33759552
-
Discovery of new butyrylcholinesterase inhibitors via structure-based virtual screening.J Enzyme Inhib Med Chem. 2019 Dec;34(1):1373-1379. doi: 10.1080/14756366.2019.1644329. J Enzyme Inhib Med Chem. 2019. PMID: 31347933 Free PMC article.
-
Expansion of the scaffold diversity for the development of highly selective butyrylcholinesterase (BChE) inhibitors: Discovery of new hits through the pharmacophore model generation, virtual screening and molecular dynamics simulation.Bioorg Chem. 2019 Apr;85:117-127. doi: 10.1016/j.bioorg.2018.12.023. Epub 2018 Dec 21. Bioorg Chem. 2019. PMID: 30605885
-
Recent Advances in Virtual Screening for Cholinesterase Inhibitors.ACS Chem Neurosci. 2021 Jan 6;12(1):30-41. doi: 10.1021/acschemneuro.0c00627. Epub 2020 Dec 22. ACS Chem Neurosci. 2021. PMID: 33350300 Review.
-
Ligand and structure-based virtual screening approaches in drug discovery: minireview.Mol Divers. 2025 Jun;29(3):2799-2809. doi: 10.1007/s11030-024-10979-6. Epub 2024 Sep 2. Mol Divers. 2025. PMID: 39223358
References
MeSH terms
Substances
LinkOut - more resources
Full Text Sources
Miscellaneous

