. 2025 May 13;14(10):1454.
doi: 10.3390/plants14101454.

Integrative Analysis of Transcriptomic and Metabolomic Profiles Uncovers the Mechanism of Color Variation in the Tea Plant Callus

Affiliations

Integrative Analysis of Transcriptomic and Metabolomic Profiles Uncovers the Mechanism of Color Variation in the Tea Plant Callus

Mengna Xiao et al. Plants (Basel). .

Abstract

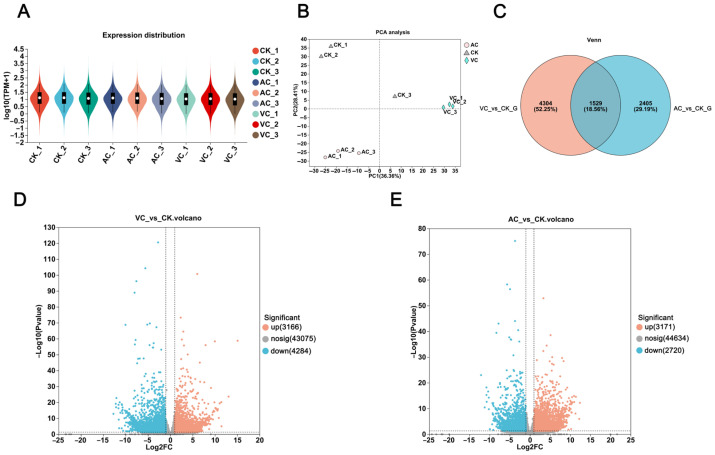
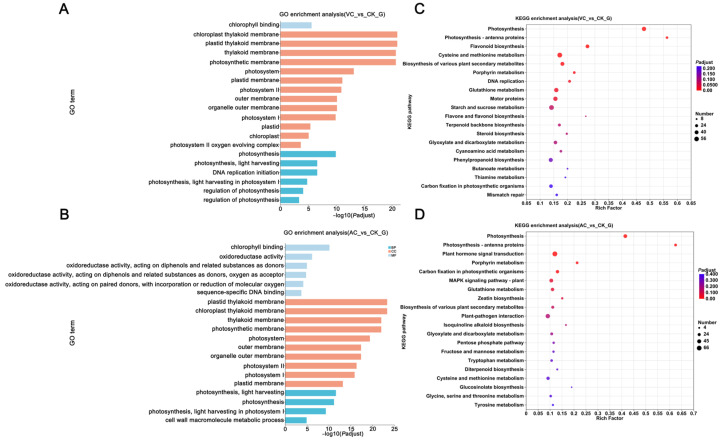
Tea plants (Camellia sinensis) are among the world's most significant economic tree species. Tissue culture serves as a crucial method in commercial breeding by facilitating the rapid propagation of valuable genotypes and the generation of disease-free clones. However, callus browning represents a prevalent challenge in tea plant tissue culture, and may adversely affect explant growth and development. Our research demonstrates that although anti-browning agents can effectively suppress browning, they induce distinct color changes in the callus. These color variations could significantly influence callus induction and subsequent growth patterns. In this study, callus tissues from C. sinensis var. Assamica cv. Mengku were employed as experimental materials and treated with three commonly used anti-browning agents: ascorbic acid (VC), activated carbon (AC), and polyvinylpyrrolidone (PVP). The results demonstrated that while these three reagents effectively inhibited browning, they also induced distinct color changes in the explants, which appeared red, green, and white, respectively. Furthermore, this study investigated the molecular mechanisms underlying callus color changes using transcriptomic and metabolomic approaches. Based on transcriptome analysis, it was revealed that photosynthesis and flavonoid biosynthesis pathways were significantly enriched. Metabolome analysis identified 14 phenolic acids, which exhibited significant variation in accumulation across calluses of different colors. The differential expression of genes involved in flavonoid biosynthesis pathways, coupled with the distinct accumulation patterns of metabolites, can effectively alleviate photooxidative damage and enhance the resistance of callus to browning. AC activates the photosynthesis of callus by regulating carbon source allocation and upregulating the expression of key genes in the psa, psb, and pet families within the photosynthetic system. This process promotes chlorophyll biosynthesis, thereby enabling the callus to grow green, while VC activates the expression of key genes such as CHS, F3H, C4H, CYP75B1, and ANR in the flavonoid pathway, which are involved in the regulation of pigment synthesis in red callus. This study elucidated the molecular mechanisms underlying the effects of anti-browning agents on color variations in C. sinensis callus, thereby providing a robust theoretical foundation for optimization, the establishment of tea plant tissue culture systems, and enhancing cultivar quality.

Keywords: Camellia sinensis; callus; flavonoid; metabolome; photosynthesis; transcriptome.


Conflict of interest statement

The authors declare no conflicts of interest.

Figures

Figure 1
Figure 1
Comprehensive transcriptomic analysis of C. sinensis callus. (A) Violin plot illustrating the distribution of DEGs in callus. (B) Principal Component Analysis (PCA) plot demonstrating the variation among callus samples. (C) Venn diagram depicting the number of overlapping DEGs across different groups. (D) Volcano plot showing DEGs identified in the VC vs. CK comparison. (E) Volcano plot highlighting DEGs detected in the AC vs. CK comparison.
Figure 2
Figure 2
KEGG and GO enrichment analysis. (A) GO enrichment analysis of DEGs in VC vs. CK; (B) GO enrichment analysis of DEGs in AC vs. CK; (C) KEGG enrichment analysis of DEGs in VC vs. CK; and (D) KEGG enrichment analysis of DEGs in AC vs. CK. BP: Biological Process; CC: Cellular Component; and MF: Molecular Function. The size of the dot represents the number of genes involved in the pathway, while the color gradient reflects the adjusted p-value, transitioning from blue (less significant, higher p-value) to red (more significant, lower p-value).
Figure 3
Figure 3
Expression patterns of photosynthesis-related genes in C. sinensis callus. The heatmap illustrates gene expression levels across three treatment groups (VC, AC, and CK), with the color gradient transitioning from blue (low expression) to red (high expression). This pathway is derived from the KEGG photosynthesis pathway.
Figure 4
Figure 4
Quantitative real-time PCR analysis of differentially expressed DEGs involved in the photosynthesis pathway. (AE) psbW, psbR, psb27, ATPF0B and ATPF1G represent the relative expression levels in callus treated with CK, AC and VC, respectively.
Figure 5
Figure 5
Metabolome analysis of C. sinensis callus. (A) Total ion chromatogram of callus; (B) PCA plot of metabolites in VC vs. CK; (C) PCA plot of metabolites in AC vs. CK; (D) fold–change bar plot of VC treatment (red callus); and (E) fold–change bar plot of AC treatment (green callus).
Figure 6
Figure 6
Differential accumulation of metabolites in C. sinensis callus. Differential metabolites (DEMs) were defined as those showing significant variations in abundance (adjusted p < 0.05, fold change > 1) between treatment groups (VC vs. CK, AC vs. CK) based on LC-MS data analysis. (A) Heatmap of metabolites in red callus (VC). (B) Heatmap of metabolites in green callus (AC). The x-axis denotes different experimental groups, while the y-axis indicates various metabolites. The color blocks at each position reflect the relative expression levels of metabolites between the two groups, with red indicating high expression and purple indicating low expression. (C) KEGG pathway enrichment analysis of metabolites in VC vs. CK; (D) KEGG pathway enrichment analysis of metabolites in AC vs. CK.
Figure 7
Figure 7
KEGG enrichment analysis results of DEGs and DEMs. (A) Combined KEGG enrichment analysis results for DEGs and DEMs in the comparison of VC vs. CK. (B) Combined KEGG enrichment analysis results for DEGs and DEMs in the comparison of AC vs. CK.
Figure 8
Figure 8
Transcriptomic and metabolomic changes in genes involved in the flavonoid biosynthesis pathway. (A) Genes participating in flavonoid biosynthesis. (B) Key metabolites involved in flavonoid metabolism. (C) Correlation analysis between differentially expressed genes and metabolites in the flavonoid biosynthesis pathway. CK: control group; VC: red callus; and AC: green callus. In the heatmap, red indicates high expression, and blue indicates low expression. Asterisks indicate significance (* p < 0.05, ** p < 0.01, *** p < 0.001).
Figure 9
Figure 9
qRT-PCR analysis of DEGs in the flavonoid biosynthesis pathway. (AE) DFR, CHS, CCoAOMT, CYP73A and CYP75B1represent the relative expression levels in callus treated with CK, AC and VC, respectively.
Figure 10
Figure 10
(AC) panels, respectively, represent callus tissues treated with ascorbic acid (VC), activated carbon (AC), and polyvinylpyrrolidone (CK).

References

    1. Lan Z., Shen X. Lancang River: The Cradle of Tea Civilization. China Forestry Publishing House; Beijing, China: 2021.
    1. Wang F., Feng H., Zheng Y., Liu R., Dong J., Wu Y., Chen S., Zhang B., Wang P., Yan J. Aroma analysis and biomarker screening of 27 tea cultivars based on four leaf color types. Food Res. Int. 2025;201:115681. doi: 10.1016/j.foodres.2025.115681. - DOI - PubMed
    1. Chacko S.M., Thambi P.T., Kuttan R., Nishigaki I. Beneficial effects of green tea: A literature review. Chin. Med. 2010;5:13. doi: 10.1186/1749-8546-5-13. - DOI - PMC - PubMed
    1. Li P., Fu J., Xu Y., Shen Y., Zhang Y., Ye Z., Tong W., Zeng X., Yang J., Tang D., et al. CsMYB1 integrates the regulation of trichome development and catechins biosynthesis in Camellia sinensis domestication. New Phytol. 2022;234:902–917. doi: 10.1111/nph.18026. - DOI - PMC - PubMed
    1. Qiu H., Zhang X., Zhang Y., Jiang X., Ren Y., Gao D., Zhu X., Usadel B., Fernie A.R., Wen W. Depicting the genetic and metabolic panorama of chemical diversity in the Camellia sinensis. Plant Biotechnol. J. 2024;22:1001–1016. doi: 10.1111/pbi.14241. - DOI - PMC - PubMed

LinkOut - more resources