Integrative Identification of Chloroplast Metabolism-Related RETICULATA-RELATED Genes in Soybean
- PMID: 40431081
- PMCID: PMC12114778
- DOI: 10.3390/plants14101516
Integrative Identification of Chloroplast Metabolism-Related RETICULATA-RELATED Genes in Soybean
Abstract
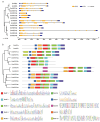
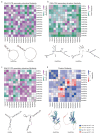
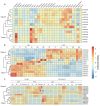
As a globally important leguminous crop, soybean (Glycine max L.) serves as a vital source of edible oils and proteins for humans and livestock. Oils in leaves can help crops combat fungal infections, adapt to temperature changes via fatty acid modulation, and support resource recycling during leaf senescence. However, accumulating oils in leaves is a fundamental challenge due to the need to balance the inherently competing photosynthesis and fatty acid biosynthesis processes within chloroplasts. RETICULATA-RELATED (RER), known to regulate chloroplast function and plastid metabolism in Arabidopsis, plays an essential role in leaf development. Here, 14 non-redundant GmRER genes were identified in soybean and phylogenetically classified into four subclades. Most Arabidopsis RER genes were evolutionarily preserved as gene duplicates in soybean, except for GmRER5 and GmRER6. RNA secondary structures spanning the coding sequences (CDSs), the 5'- and 3'- untranslated regions (UTRs) of GmRERs, displayed exceptional structural plasticity in CDSs, while exhibiting limited conservation in UTRs. In contrast, protein structures retained conserved folds, underscoring evolutionary constraints on functional domains despite transcriptional plasticity. Notably, GmRER4a and GmRER4b represented an exceptional case of high similarity in both protein and RNA structures. Expression profiling across fourteen tissues and three abiotic stress conditions revealed a dynamic shift in expression levels between leaf-predominant and root-enriched GmRER paralogs after stress treatments. A comparative transcriptome analysis of six soybean landraces further revealed transcriptional polymorphism in the GmRER family, which was associated with the expression patterns of lipid biosynthesis regulators. Our comprehensive characterization of GmRERs may offer potential targets for soybean breeding optimization in overall plant oil production.
Keywords: RETICULATA-RELATED genes; RNA/protein structural analysis; chloroplast development; soybean; transcriptomics analysis.
Conflict of interest statement
The authors declare no conflicts of interest.
Figures


Similar articles
-
Genome-wide analysis of filamentous temperature-sensitive H protease (ftsH) gene family in soybean.BMC Genomics. 2024 May 27;25(1):524. doi: 10.1186/s12864-024-10389-w. BMC Genomics. 2024. PMID: 38802777 Free PMC article.
-
Soybean (Glycine max) WRINKLED1 transcription factor, GmWRI1a, positively regulates seed oil accumulation.Mol Genet Genomics. 2018 Apr;293(2):401-415. doi: 10.1007/s00438-017-1393-2. Epub 2017 Nov 14. Mol Genet Genomics. 2018. PMID: 29138932
-
Genome-Wide Identification and Comprehensive Analysis of the FtsH Gene Family in Soybean (Glycine max).Int J Mol Sci. 2023 Nov 30;24(23):16996. doi: 10.3390/ijms242316996. Int J Mol Sci. 2023. PMID: 38069319 Free PMC article.
-
Comprehensive characterization and RNA-Seq profiling of the HD-Zip transcription factor family in soybean (Glycine max) during dehydration and salt stress.BMC Genomics. 2014 Nov 3;15:950. doi: 10.1186/1471-2164-15-950. BMC Genomics. 2014. PMID: 25362847 Free PMC article.
-
Genome-wide characterization and analysis of the CCT motif family genes in soybean (Glycine max).Planta. 2021 Jan 3;253(1):15. doi: 10.1007/s00425-020-03537-5. Planta. 2021. PMID: 33392793
References
-
- Hartman G.L., West E.D., Herman T.K. Crops That Feed the World 2. Soybean—Worldwide Production, Use, and Constraints Caused by Pathogens and Pests. Food Sec. 2011;3:5–17. doi: 10.1007/s12571-010-0108-x. - DOI
-
- Pagano M.C., Miransari M. The Importance of Soybean Production Worldwide. In: Miransari M., editor. Abiotic and Biotic Stresses in Soybean Production. Academic Press; San Diego, CA, USA: 2016. pp. 1–26.
Grants and funding
- 2023ZD0403702/the Biological Breeding-National Science and Technology Major Project
- QT202326/the Jilin Province Young Science and Technology Talent Support Project
- 2412023QD020/the Fundamental Research Fund for Central Universities
- 111865021/the Talents Supporting Project of Jilin Province
- 2412023YQ005/the Fundamental Research Fund for Central Universities
LinkOut - more resources
Full Text Sources
Research Materials

