. 2025 Apr 25;13(5):991.
doi: 10.3390/microorganisms13050991.

Infection with the Endonuclear Symbiotic Bacterium Holospora obtusa Reversibly Alters Surface Antigen Expression of the Host Paramecium caudatum

Affiliations

Infection with the Endonuclear Symbiotic Bacterium Holospora obtusa Reversibly Alters Surface Antigen Expression of the Host Paramecium caudatum

Masahiro Fujishima. Microorganisms. .

Abstract

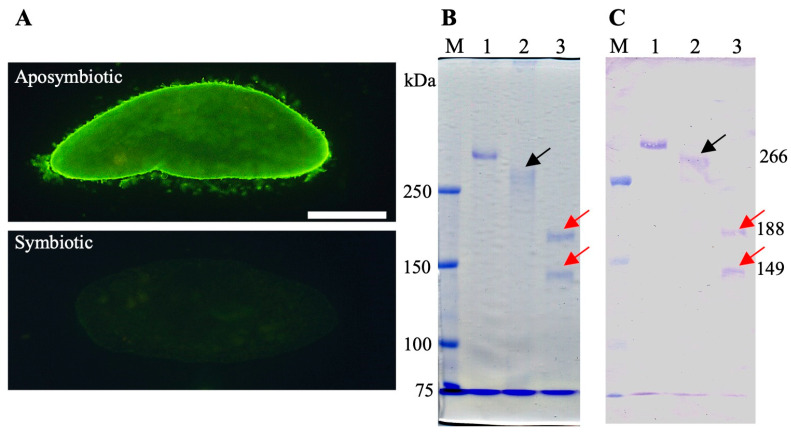
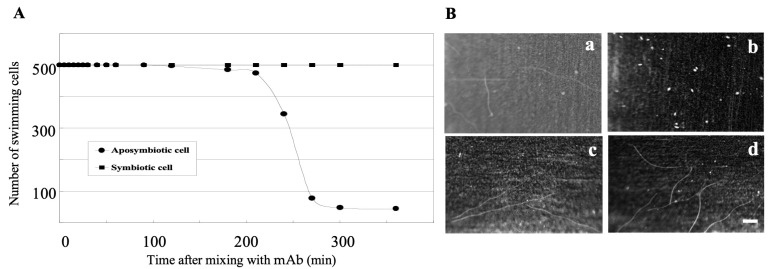
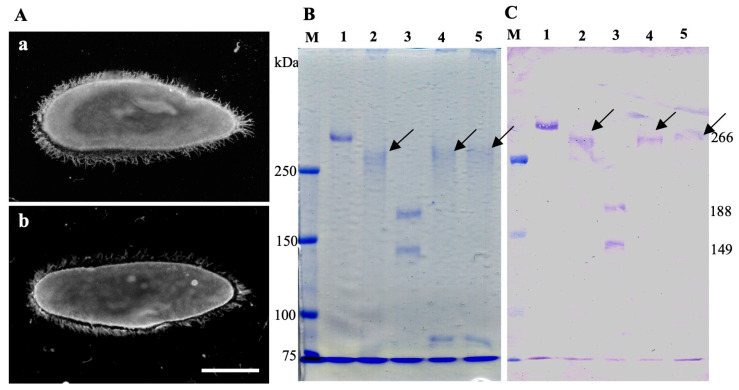
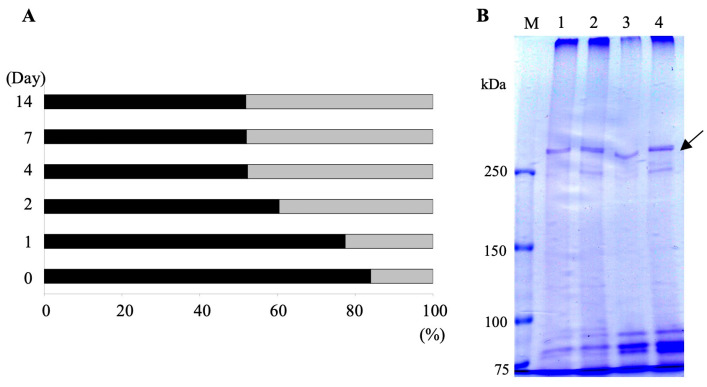
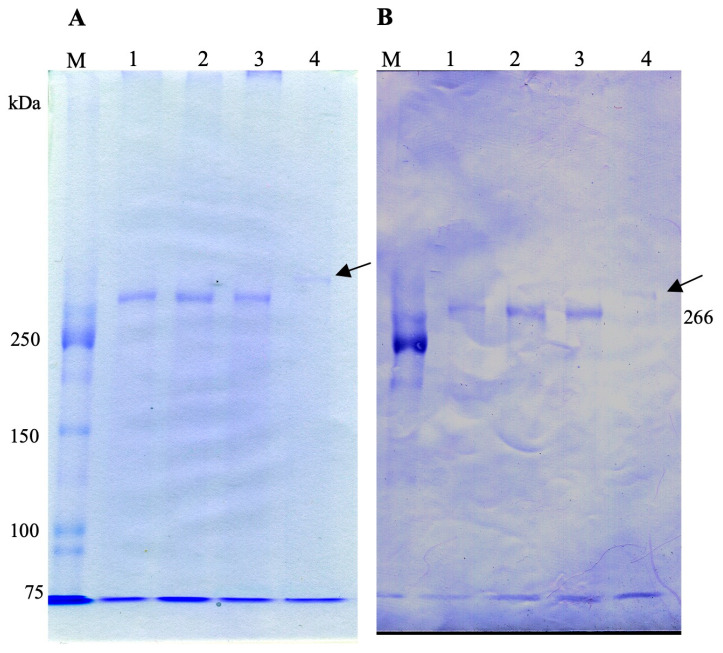
It is known that the ciliate Paramecium cell surface including cilia is completely covered by high-molecular-mass GPI-anchored proteins named surface antigens (SAgs). However, their functions are not well understood. It was found that ciliate Paramecium caudatum reversibly changes its SAgs depending on the absence or presence of the endonuclear symbiotic bacterium Holospora obtusa in the macronucleus. Immunofluorescence microscopy with a monoclonal antibody produced SAg of the H. obtusa-free P. caudatum strain RB-1-labeled cell surface of the H. obtusa-free P. caudatum RB-1 cell but not the H. obtusa-bearing RB-1 cell. When this antibody was added to the living P. caudatum RB-1 cells, only H. obtusa-free cells were immobilized. An immunoblot with SAgs extracted from Paramecium via cold salt/ethanol treatment showed approximately 266-kDa SAgs in the extract from H. obtusa-free cells and 188 and 149-kDa SAgs in the extract from H. obtusa-bearing cells. H. obtusa-free RB-1 cells produced from H. obtusa-bearing cells via treatment with penicillin-G-potassium re-expressed 266-kDa SAg, while the 188 and 149-kDa SAgs disappeared. This phenotypic change in the SAgs was not induced by degrees of starvation or temperature shifts. These results definitively show that Paramecium SAgs have functions related to bacterial infection.

Keywords: GPI-anchored surface protein; Holospora obtusa; Paramecium caudatum; bacterial infection; endonuclear symbiotic bacteria; endosymbiosis; immobilization antigen; phenotypic change in the host; surface antigen.


Conflict of interest statement

The author declares no conflicts of interest.

Figures

Figure 1
Figure 1
Indirect immunofluorescence and immunoblot of aposymbiotic and symbiotic P. caudatum RB-1 cells with mAb SAgPC. Paramecium cells in the early stationary phase of growth were used. This mAb was developed by injecting whole cells of the aposymbiotic P. caudatum RB-1 cells into mice. (A) Indirect immunofluorescence micrographs of aposymbiotic and symbiotic RB-1 cell. Note that the cilia and cell body show strong FITC fluorescence in the aposymbiotic cell but not in the symbiotic cell infected with H. obtusa F1 in the macronucleus. (B) CBB-stained SDS-PAGE gel of cold salt/ethanol extracts. (C) Immunoblot with mAb SAgPC. Lane 1, extracts of P. tetraurelia stock 51 cells. Lane 2, extract of aposymbiotic P. caudatum RB-1 cells. Lane 3, extract of symbiotic P. caudatum RB-1 cells. Lane M, pre-stained molecular mass markers. Note that mAb cross-reacted with a high molecular mass SAg of P. tetraurelia stock 51. Black arrow, aposymbiotic P. caudatum RB-1-specific SAg (about 266-kDa). Red arrow, symbiotic P. caudatum RB-1-specific SAgs (188 and 149-kDa). Since the molecular masses of the SAgs of P. tetraurelia strain 51 are reported to be from 250 to 300 kDa [4], using the band in lane 1 as a 300-kDa marker, the molecular mass of a band extracted from aposymbiotic P. caudatum RB-1 cells was calculated to be 266-kDa (lane 2). Note that even though two low-molecular-weight SAg bands were detected by immunoblotting in symbiotic P. caudatum (B,C), FITC fluorescence was only detected in symbiotic P. caudatum by indirect immunofluorescence microscopy (A). Scale bar, 50 μm.
Figure 2
Figure 2
Immobilization test of P. caudatum RB-1 cells with mAb SAgPC. (A) Kinetics of immobilization test of aposymbiotic and symbiotic RB-1 cells treated with the mAb. Cells in the early stationary phase of growth were mixed with the mAb at 25 °C and observed under a stereomicroscope (see Section 2.2). Note that only the aposymbiotic cells were immobilized, but symbiotic cells were not. Closed circle, aposymbiotic cells. Closed square, symbiotic cell. (B) Swimming loci of the aposymbiotic P. caudatum RB-1 cells (a and b) and symbiotic cells (c and d). Cells were mixed with mAb (b and d) or with modified Dryl’s solution (MDS) (a and c) and photographed with 2 s exposures at 270 min after the mixing at 25 °C. Note that only the aposymbiotic cells (b) were immobilized by the mAb. To clarify the swimming loci in (bd), slight adjustments in brightness and contrast were made in Photoshop without altering or distorting the information in the figure. Scale bar, 1 mm.
Figure 3
Figure 3
Reversibility of SAg expression in aposymbiotic P. caudatum cells obtained from symbiotic cells via penicillin-G-potassium treatment. Paramecium cells in the early stationary phase of growth were used. (A) Indirect immunofluorescence micrographs with mAb SAgPC. (a) Original aposymbiotic P. caudatum RB-1 cell before infection with H. obtusa. (b) Aposymbiotic P. caudatum RB-1 cell obtained from symbiotic cells by penicillin treatment. Note that if H. obtusa is removed from the macronucleus by penicillin treatment, cell surface of the host P. caudatum becomes labeled by indirect immunofluorescence microscopy with the mAb. (B) CBB-stained SDS-PAGE gel of cold salt/ethanol extracts. (C) Immunoblot of B with the mAb. Lane 1, an extract of P. tetraurelia stock 51 cells. Lane 2, an extract of original aposymbiotic P. caudatum RB-1 cells. Lane 3, an extract of symbiotic P. caudatum RB-1 cells. Lane 4, an extract of original aposymbiotic P. caudatum RB-1 cells treated with penicillin. Lane 5, an extract of aposymbiotic cells obtained from penicillin-treated symbiotic cells. Lane M, pre-stained molecular mass markers. Arrow, 266-kDa SAg. Scale bar, 50 μm.
Figure 4
Figure 4
Effects of starvation on 266-kDa SAg expression. (A) Aposymbiotic P. caudatum strain RB-1 cells in the early stationary phase of growth were washed with MDS and suspended in MDS for 1, 2, 4, 7, and 14 days at 25 °C to induce a state of starvation, and the ratio of cells exhibiting FITC fluorescence on their surfaces was examined via indirect immunofluorescence microscopy using mAb SAgPC by observing 150–200 cells each. Black bars, the percentage of cells showing FITC fluorescence, i.e., the percentage of cells expressing 266-kDa SAg. Gray bars, the percentage of cells showing no FITC fluorescence. (B) CBB-stained SDS-PAGE gel. Cell extracts were obtained from starved cells via salt/ethanol extraction 0 (lane 1), 2 (lane 2), 4 (lane 3), and 7 (lane 4) days after washing and loaded onto SDS-PAGE. Slight adjustment in brightness was made in Photoshop without altering or distorting the information in the figure. Lane M, pre-stained molecular mass markers. Arrow, 266-kDa SAg. Note that the 266-kDa band was kept in all lanes and both the 188 and 149-kDa bands did not appear.
Figure 5
Figure 5
Effect of different temperatures on SAg expression in aposymbiotic P. caudatum RB-1 cells. The cells were cultivated at 25 °C, and the cells in the stationary phase of growth were incubated for 24 h at temperatures of 10 °C (lane 1), 15 °C (lane 2), 25 °C (lane 3), and 35 °C (lane 4). Then, their SAgs were extracted by salt/ethanol treatment and loaded onto SDS-PAGE and immunoblot. (A) SDS-PAGE gel stained with CBB. (B) immunoblot with mAb SAgPC. Note that the molecular mass of SAgs expressed at 10 °C, 15 °C, and 25 °C was 266-kDa. At 35 °C, however, the 266-kDa band disappeared and a new thin SAg band with a slightly higher molecular mass appeared (arrow, lane 4). Lane M, pre-stained molecular mass markers.

Similar articles

References

    1. Beal G.H., Mott M.R. Further studies on the antigens of Paramecium aurelia with the aid of fluorescent antibodies. J. Gen. Microbiol. 1962;17:68–74. doi: 10.1099/00221287-17-1-68. - DOI - PubMed
    1. Mott M.R. Electron microscopy studies on the immobilization antigens of Paramecium aurelia. J. Gen. Microbiol. 1965;41:251–261. doi: 10.1099/00221287-41-2-251. - DOI - PubMed
    1. Preer J.R., Jr. Genetics of the protozoa. In: Chen T.T., editor. Research in Protozoology 3. Pergamon; Oxford, UK: 1968. pp. 129–278.
    1. Preer J.R., Jr., Preer L.B., Rudman B.M. mRNAs for the immobilization antigens of Paramecium. Proc. Natl. Acad. Sci. USA. 1981;78:6776–6778. doi: 10.1073/pnas.78.11.6776. - DOI - PMC - PubMed
    1. Prat A., Katinka M., Caron F., Meyer E. Nucleotide sequence of the Paramecium primaurelia G surface protein: A huge protein with a highly periodic structure. J. Mol. Biol. 1986;189:47–60. doi: 10.1016/0022-2836(86)90380-3. - DOI - PubMed

LinkOut - more resources