. 2025 Apr 27;13(5):1006.
doi: 10.3390/microorganisms13051006.

Transcriptomic Insights into the Degradation Mechanisms of Fomitopsis pinicola and Its Host Preference for Coniferous over Broadleaf Deadwood

Affiliations

Transcriptomic Insights into the Degradation Mechanisms of Fomitopsis pinicola and Its Host Preference for Coniferous over Broadleaf Deadwood

Jianbin Xue et al. Microorganisms. .

Abstract

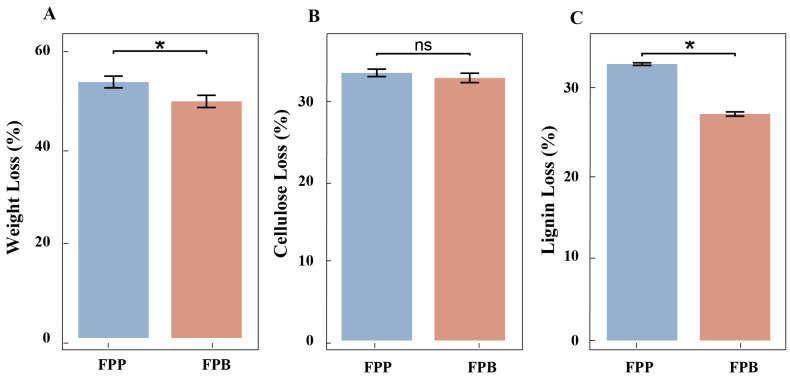
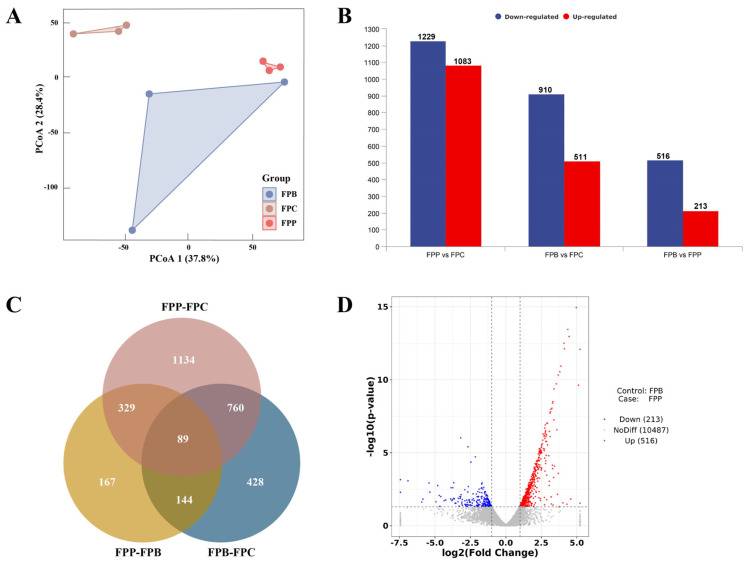
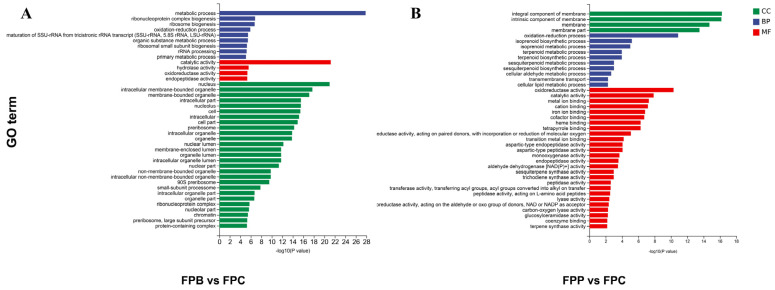
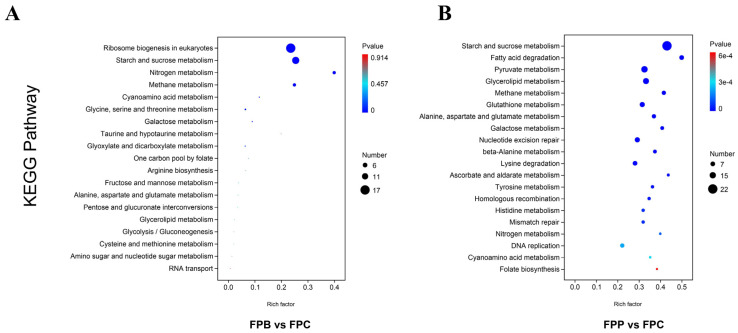
The degradation of deadwood is a vital ecological process for geochemical cycling and biodiversity conservation, with two main routes of fungal degradation: brown and white rot. Brown rot fungi cause severe destruction of wood cellulose and lead to brown and modified lignin residue. Fomitopsis pinicola is a typical brown rot fungus with a distinct host preference for coniferous trees. The mechanisms through which this fungus degrades coniferous and broadleaf wood remain poorly understood. Therefore, in this study, a 60-day cultivation experiment involving F. pinicola growing on deadwood strips of Pinus koraiensis and Betula platyphylla separately was performed. A comparative transcriptome analysis was carried out to explore the mechanisms underlying the differences in degradation, in terms of both physicochemical properties and transcriptomic data. The findings revealed that the host preference of F. pinicola resulted in the more efficient degradation of coniferous wood than broadleaf wood, accompanied by higher gene expression levels. GO enrichment analysis indicated that this preference was primarily associated with the hydrolytic enzyme family and processes related to the Fenton reaction, which is characteristic of brown rot fungi. Furthermore, the KEGG pathways showed that the DEGs were enriched in mainly included histidine metabolism, fatty acid degradation, and so on, indicating underlying carbohydrate and lipid metabolism processes. These results support P. pinicola's strong ability to degrade the deadwood lignin of P. koraiensis, reflecting its adaptive evolution in host selection and choice of different ecological niches.

Keywords: Fomitopsis pinicola; brown rot; comparative transcriptome analysis; degradation discrepancy mechanism.


Conflict of interest statement

The authors declare no conflicts of interest. The funders had no role in the design of the study; in the collection, analyses, or interpretation of the data; in the writing of the manuscript; or in the decision to publish the results.

Figures

Figure 1
Figure 1
Changes in weight loss, cellulose loss, and lignin loss of wooden strips after 60 days of decomposition with F. pinicola. FPP represents wooden strips of P. koraiensis decomposed by F. pinicola, and FPB represents wooden strips of B. platyphylla decomposed by F. pinicola. (A) Weight loss of wooden strips. (B) Cellulose loss of wooden strips. (C) Lignin loss of wooden strips. Asterisks (*) show a significant difference between F. pinicola-degraded pinewood and F. pinicola-degraded birchwood (p < 0.05) and “ns” represents no significant difference.
Figure 2
Figure 2
Overall analysis of differentially expressed genes in mycelium after 60 days of degradation across all groups. (A) Principal coordinate analysis (PCoA) of samples in the FPC, FPP, and FPB groups. (B) Number of differentially expressed genes in the FPP vs. FPC, FPB vs. FPC, and FPP vs. FPB group comparisons. (C) Venn diagram of differentially expressed genes (DEGs) in the transcriptome. The sum of the numbers in each circle represents the total number of DEGs in the comparison, and the overlap of the circles represents the common DEGs between the two groups compared. (D) A volcano map of the numbers of upregulated and downregulated genes in FPP compared with FPB (p < 0.05; log2(fold change) > 1 or <−1).
Figure 3
Figure 3
GO analyses of the differentially expressed genes in collected hyphae of F. pinicola following different degradation treatments. (A,B) Quantitative histograms of GO gene enrichment for FPB vs. FFC and FPP vs. FFC. MF: molecular function; BP: biological process; CC: cell component. The vertical axis represents the GO term, and the horizontal axis represents the −log10 (p-value) for GO term enrichment.
Figure 4
Figure 4
KEGG analyses of the differentially expressed genes in collected F. pinicola hyphae following different degradation treatments. (A) KEGG enrichment bubble charts of FPB vs. FPC comparison. (B) KEGG enrichment bubble charts for FPP vs. FPC comparison. The horizontal axis is the enrichment factor (expressed as the ratio of the number of differentially expressed genes annotated to the pathway/total number of expressed genes annotated to the pathway). The top pathways with the lowest p-values were used to produce the map, where the ordinate represents the pathway, the abscissa represents the enrichment factor (the number of differences in the pathway divided by all numbers), the size of each circle indicates the number of DEGs, and the color represents the significance (the bluer the color, the smaller the p-value). More differentially expressed genes are enriched in those pathways with bluer and larger circles.

Similar articles

References

    1. Harmon M., Franklin J., Swanson F., Sollins P., Gregory S., Lattin J., Anderson N. Ecology of coarse wooden debris in temperate ecosystems. Adv. Ecol. Res. 1986;15:133–302.
    1. Stokland J., Siitonen J., Jonsson B. Biodiversity in Dead Wood. Cambridge University Press; New York, NY, USA: 2012.
    1. Oberle B., Ogle K., Zanne A.E., Woodall C.W. When a tree falls: Controls on wood decay predict standing dead tree fall and new risks in Changing forests. PLoS ONE. 2018;13:e0196712. doi: 10.1371/journal.pone.0196712. - DOI - PMC - PubMed
    1. Bugg T.D.H., Ahmad M., Hardiman E.M., Rahmanpour R. Pathways for degradation of lignin in bacteria and fungi. Nat. Prod. Rep. 2011;28:1871–1960. doi: 10.1039/c1np00042j. - DOI - PubMed
    1. Floudas D., Binder M., Riley R., Barry K., Blanchette R.A., Henrissat B., Martínez A.T., Otillar R., Spatafora J.W., Yadav J.S., et al. The paleozoic origin of enzymatic lignin decomposition reconstructed from 31 fungal genomes. Science. 2012;336:1715–1719. doi: 10.1126/science.1221748. - DOI - PubMed

LinkOut - more resources