. 2025 May 14;13(5):1129.
doi: 10.3390/microorganisms13051129.

Comparative Genomic Analysis of Two Vibrio harveyi Strains from Larimichthys crocea with Divergent Virulence Profiles

Affiliations

Comparative Genomic Analysis of Two Vibrio harveyi Strains from Larimichthys crocea with Divergent Virulence Profiles

Kequan Wang et al. Microorganisms. .

Abstract

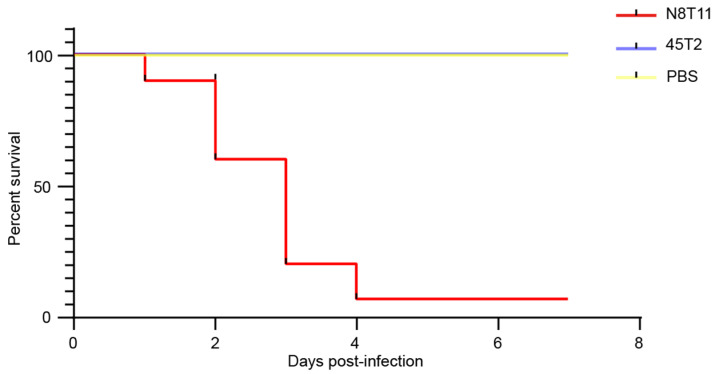
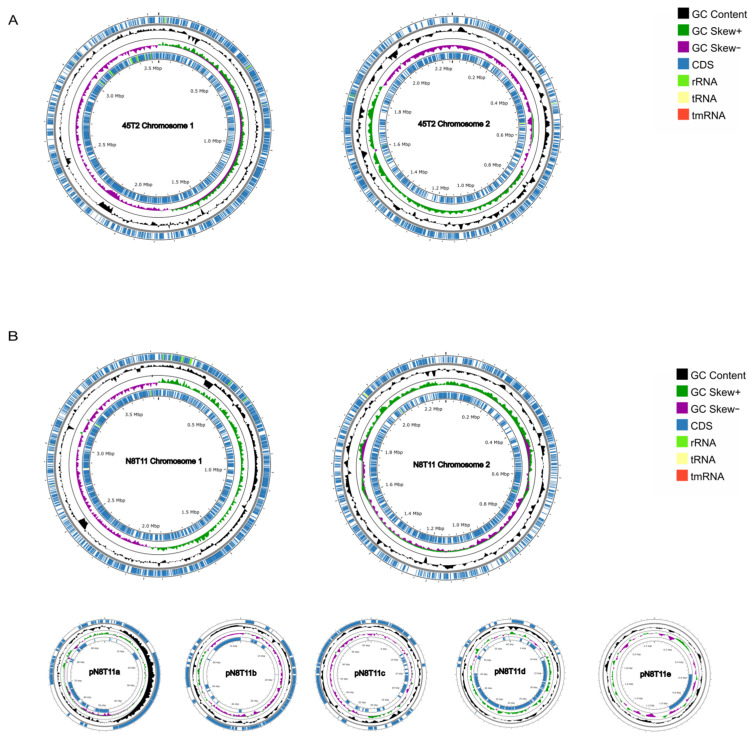
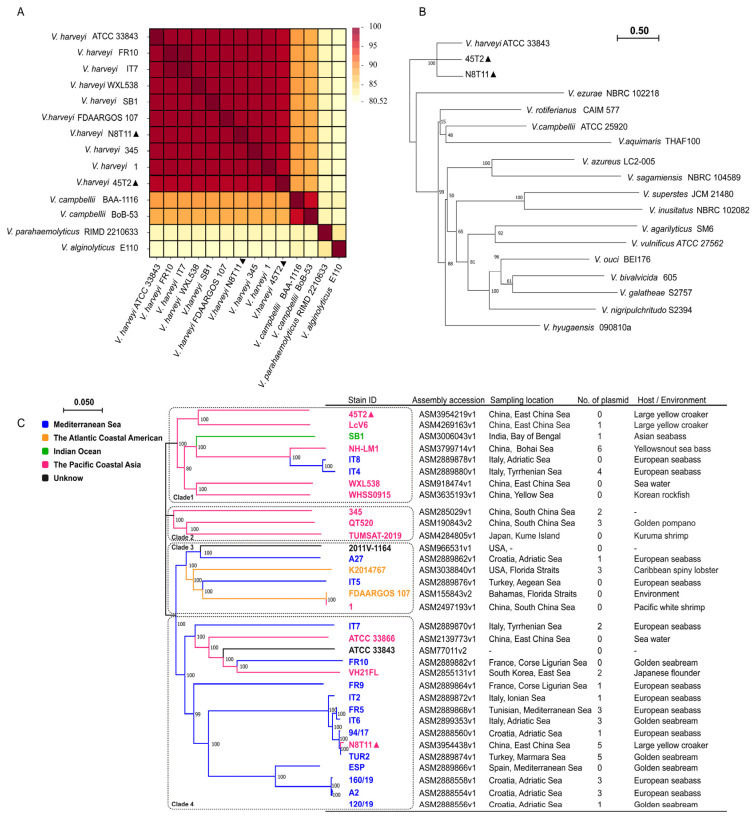
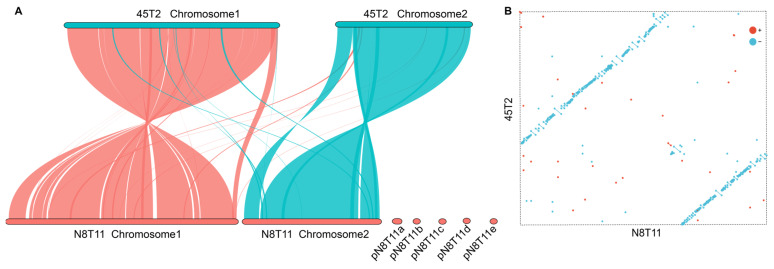
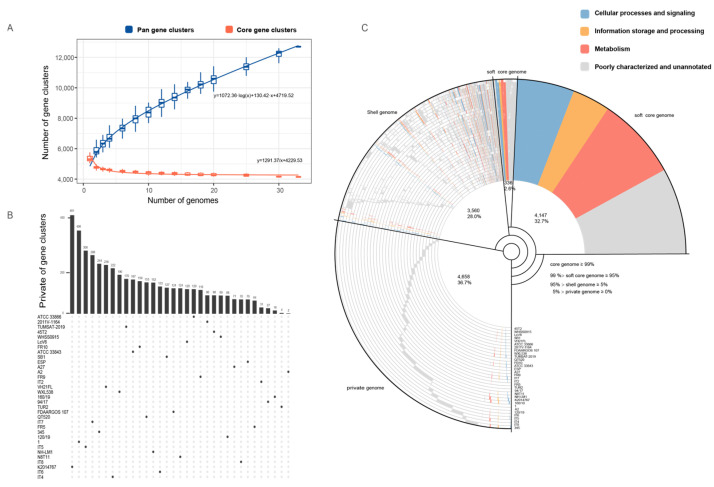
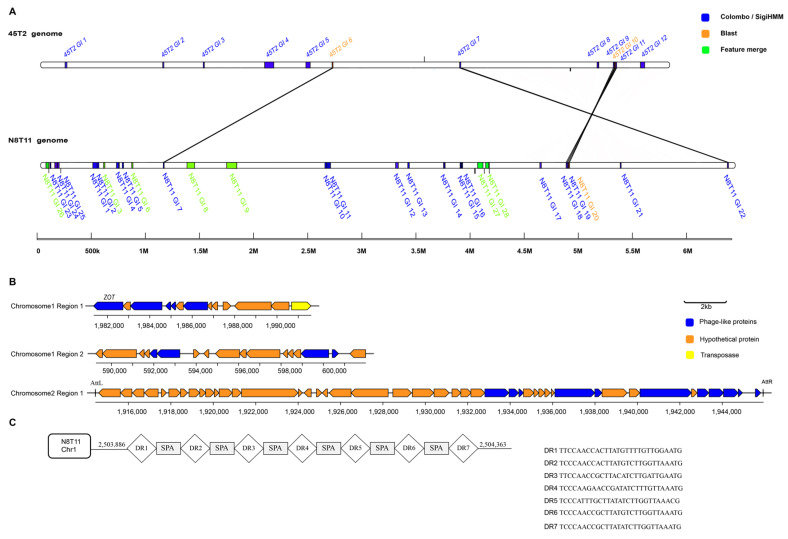
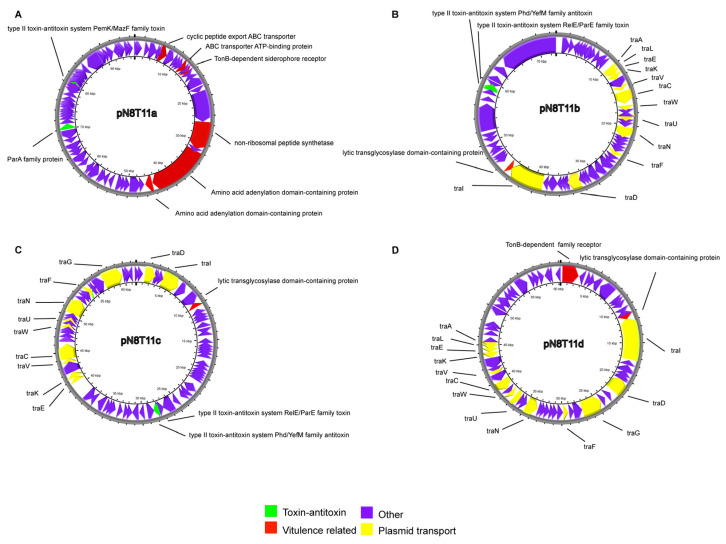
Vibrio harveyi is a significant pathogen in marine aquaculture, causing vibriosis in various marine species. This study presents a comparative genomic analysis of two V. harveyi strains, N8T11 and 45T2, which exhibit differing virulence profiles. Virulence assays revealed that N8T11 caused 92% mortality in infected fish, while 45T2 resulted in 0% mortality. Whole-genome sequencing revealed that strain N8T11 harbors five plasmids (pN8T11a, pN8T11b, pN8T11c, pN8T11d and pN8T11e) absent in 45T2, encoding genes potentially linked to virulence, such as siderophore-mediated iron acquisition and stress response mechanisms. Pan-genome analysis highlighted substantial genomic plasticity within V. harveyi, with mobile genetic elements, including plasmids and prophages, contributing to horizontal gene transfer. Conjugation experiments demonstrated that all five N8T11 plasmids can transfer to 45T2 with efficiencies up to 87%, with pN8T11b remaining stable across multiple subcultures, enabling the dissemination of virulence-associated genes. These findings suggest that plasmid-mediated gene transfer plays a role in the virulence variability observed between V. harveyi strains. This study contributes to understanding the genomic factors underlying pathogenicity in V. harveyi and provides insights for future research aimed at controlling vibriosis in aquaculture.

Keywords: Vibrio harveyi; comparative genomics; mobile genetic elements; plasmid transfer; virulence factors.


Conflict of interest statement

The authors declare no conflicts of interest.

Figures

Figure 1
Figure 1
Comparative virulence assessment of V. harveyi strains N8T11 and 45T2 in large yellow croaker. Kaplan–Meier survival curves showing cumulative mortality over seven days following intramuscular infection with V. harveyi strains N8T11 (red line) and 45T2 (blue line). The higher mortality rate observed in fish infected with strain N8T11 highlights its elevated virulence compared to the less-virulent strain 45T2.
Figure 2
Figure 2
Circular genome plots of V. harveyi strains 45T2 and N8T11. (A) represents the circular genome of strain 45T2, while (B) illustrates the genome of strain N8T11, which includes five plasmids (pN8T11a–pN8T11e). From the outermost to the innermost rings: the first ring displays coding sequences (CDS), tRNA, rRNA, and mRNA on the positive strand; the second ring represents the genome size; the third ring illustrates GC content, where outward peaks indicate regions with higher-than-average GC content and inward peaks indicate lower-than-average GC content, with peak height reflecting the deviation from the mean; the fourth ring shows GC-skew, calculated as (G − C)/(G + C), where positive and negative values reflect strand asymmetry. The innermost ring displays CDS, tRNA, and rRNA on the negative strand.
Figure 3
Figure 3
COG-based functional classification of genes in V. harveyi strains N8T11 and 45T2. The horizontal axis displays the COG functional categories, while the vertical axis indicates the number of genes assigned to each category. Each bar represents the distribution of genes across the COG categories for strains N8T11 and 45T2. A legend on the right provides descriptions of the functional categories, highlighting differences and similarities in gene function between the two strains.
Figure 4
Figure 4
ANI heatmap and phylogenetic analysis of V. harveyi strains. The strains N8T11 and 45T2 sequenced in this study are marked with “▲” in the figures. (A) ANI heatmap showing pairwise similarity scores among 14 genomes, including V. harveyi strains N8T11 and 45T2, eight additional V. harveyi strains, two V. campbellii strains, one V. parahaemolyticus strain, and one V. alginolyticus strain. Higher ANI values indicate greater genomic similarity. (B) A maximum likelihood phylogenetic tree was constructed based on whole-genome concatenated alignments, with branch support assessed using 100 bootstrap replicates. The tree provides insights into the evolutionary relationships among the analyzed strains. (C) An intraspecies phylogenetic tree of V. harveyi illustrates five distinct color-coded clades representing geographic and genomic traits: Mediterranean (blue), Atlantic American (yellow), Indian Ocean (green), Pacific Asian (pink), and Unknown (black).
Figure 5
Figure 5
Comparative genomic collinearity of V. harveyi strains N8T11 and 45T2. (A) Collinearity analysis illustrating the conservation of gene order and sequence similarity between the two strains. Each axis represents the genomic sequence of one strain, with genes plotted based on their genomic positions. Lines connecting the axes indicate orthologous gene pairs, highlighting regions of high conservation and structural synteny. (B) Two-dimensional dot plot comparison of the genomes. The vertical axis represents the 45T2 genome, and the horizontal axis represents the N8T11 genome. Red dots indicate co-linear genomic fragments aligned in the same direction, while blue dots represent inverted fragments, reflecting structural rearrangements between the two strains.
Figure 6
Figure 6
Pan-genome analysis of V. harveyi. (A) Pan-genome and core genome growth curves illustrating the relationship between the number of strains analyzed and gene cluster accumulation. The growth trends for core gene clusters (red line: y = 1291.37/x + 4229.53) and pan-gene clusters (blue line: y = 1072.36·log(x) + 130.42·x + 4719.52) were modeled based on data from 33 V. harveyi strains. (B) An Upset plot shows the distribution of unique and shared gene clusters across the analyzed strains, highlighting strain-specific and conserved gene sets. (C) COG annotation categorizes gene clusters into four groups: Core genome, Soft-core genome, Shell genome, and Private genome, as described in the text. Functional classifications are represented by blue for Cellular Processes and Signaling, yellow for Information Storage and Processing, red for Metabolism, and gray for poorly characterized or unannotated genes.
Figure 7
Figure 7
(A) Genomic islands detected in the genomes of N8T11 and 45T2, including several located on plasmids. Predictions were made using Colombo/SigiHMM (blue), BLAST (version 2.13.0; orange), and feature merging (green). (B) Prophage structures identified in the N8T11 genome are illustrated, highlighting intact prophages with detailed annotations of their open reading frames (ORFs) and phage attachment sites. (C) CRISPR-Cas systems identified in N8T11 are shown, displaying the genomic organization and arrangement of CRISPR arrays.
Figure 8
Figure 8
Annotation and functional characterization of V. harveyi N8T11 plasmids. Genomic maps of plasmids pN8T11a (A), pN8T11b (B), pN8T11c (C), and pN8T11d (D), highlighting key functional gene clusters. Yellow ORFs represent genes associated with F-type transport systems, red ORFs indicate potential strain-specific virulence genes, and green ORFs denote toxin-antitoxin system genes. Plasmid pN8T11e is not shown, as it contains only a single annotated ORF. Plasmid pN8T11e is not shown due to its single annotated ORF.
Figure 9
Figure 9
Validation of plasmid transfer from V. harveyi N8T11 to 45T2. (A,B) PCR validation of donor strain N8T11 and recipient strain 45T2 after antibiotic selection, confirming the presence of plasmid-specific target genes. (CG) Specific PCR amplification patterns for individual plasmids pN8T11a, pN8T11b, pN8T11c, pN8T11d, and pN8T11e using plasmid-specific primers. Each panel displays distinct bands corresponding to plasmid-carried genes, verifying their presence and stability in the recipient strain 45T2. Lanes are labeled as M (DNA marker), P (positive control), and N (negative control).

Similar articles

References

    1. Zhang X.H., He X., Austin B. Vibrio harveyi: A serious pathogen of fish and invertebrates in mariculture. Mar. Life Sci. Technol. 2020;2:231–245. doi: 10.1007/s42995-020-00037-z. - DOI - PMC - PubMed
    1. Ruwandeepika H.A.D., Jayaweera T.S.P., Bhowmick P.P., Karunasagar I., Bossier P., Defoirdt T. Pathogenesis, virulence factors and virulence regulation of vibrios belonging to the Harveyi clade. Rev. Aquac. 2012;4:59–74. doi: 10.1111/j.1753-5131.2012.01061.x. - DOI
    1. Austin B., Zhang X.H. Vibrio harveyi: A significant pathogen of marine vertebrates and invertebrates. Lett. Appl. Microbiol. 2006;43:119–124. doi: 10.1111/j.1472-765X.2006.01989.x. - DOI - PubMed
    1. Xu K., Wang Y., Yang W., Cai H., Zhang Y., Huang L. Strategies for Prevention and Control of Vibriosis in Asian Fish Culture. Vaccines. 2023;11:98. doi: 10.3390/vaccines11010098. - DOI - PMC - PubMed
    1. Montanchez I., Kaberdin V.R. Vibrio harveyi: A brief survey of general characteristics and recent epidemiological traits associated with climate change. Mar. Environ. Res. 2020;154:104850. doi: 10.1016/j.marenvres.2019.104850. - DOI - PubMed

LinkOut - more resources