

The Impact of Litter from Different Belowground Organs of Phragmites australis on Microbial-Mediated Soil Organic Carbon Accumulation in a Lacustrine Wetland
- PMID: 40431316
- PMCID: PMC12114342
- DOI: 10.3390/microorganisms13051146
The Impact of Litter from Different Belowground Organs of Phragmites australis on Microbial-Mediated Soil Organic Carbon Accumulation in a Lacustrine Wetland
Abstract
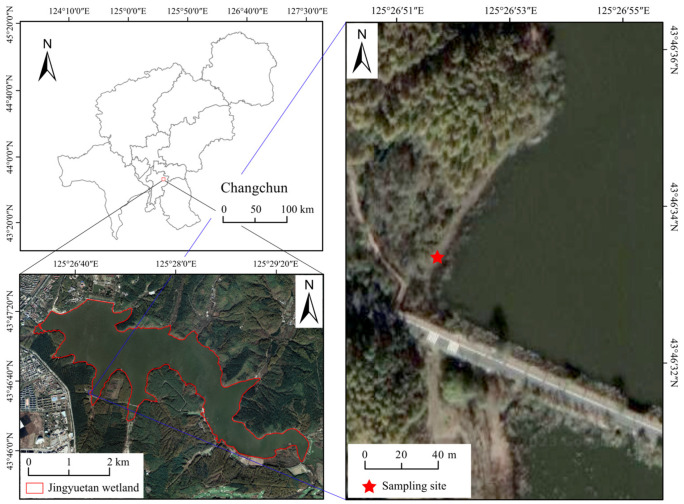
Although belowground litter decomposition critically influences lacustrine wetland soil carbon dynamics, the organ-specific microbial mechanisms driving soil organic carbon (SOC) accumulation remain unclear. Existing research has predominantly focused on aboveground litter, leaving a significant gap in the understanding of how roots and rhizomes differentially regulate carbon cycling through microbial community assembly and survival strategies. This study took Phragmites australis (a plant characteristic of lacustrine wetland) as the research object and examined how decomposing belowground litter from different organs affects microbial-mediated SOC accumulation through a one-year in situ field incubation in Jingyuetan National Forest Park, Changchun City, Jilin Province, China. Our findings reveal that root litter exhibited the highest decomposition rate, which was accelerated by intermittent flooding, reaching up to 1.86 times that of rhizome. This process enriched r-strategist microbial taxa, intensified homogeneous selection, and expanded niche width, directly promoting SOC accumulation. Rhizome litter decomposition enhanced dispersal limitation, promoted K-strategist microbial dominance, and indirectly modulated SOC through soil acidification. Mixed-litter treatments significantly enhanced SOC accumulation (up to three times higher than single-litter treatments) through synergistic nutrient release (non-additive effects < 0.04) and reinforced microbial network interactions. SOC accumulation varied significantly with the flooding regime as follows: non-flooded > intermittent flooding > permanent flooding. This study provides new insights into the microbially driven mechanisms of plant-organ-specific decomposition in the carbon cycling of wetland ecosystems.
Keywords: belowground plant litter; community assembly; soil microorganisms; soil organic carbon; survival strategies.
Conflict of interest statement
The authors declare no conflicts of interest.
Figures
Similar articles
-
Changes in plant inputs alter soil carbon and microbial communities in forest ecosystems.Glob Chang Biol. 2022 May;28(10):3426-3440. doi: 10.1111/gcb.16107. Epub 2022 Feb 10. Glob Chang Biol. 2022. PMID: 35092113
-
Tree species selection for optimizing soil carbon storage: Insights from litter decomposition and bacterial community analysis in coastal ecosystems.J Environ Manage. 2024 Nov;370:122984. doi: 10.1016/j.jenvman.2024.122984. Epub 2024 Oct 21. J Environ Manage. 2024. PMID: 39437689
-
Temporal dynamics of nutrient release from mulching of legume roots and shoots litter driven by microbial community during decomposition in organic orchards.BMC Plant Biol. 2025 Mar 24;25(1):374. doi: 10.1186/s12870-025-06392-2. BMC Plant Biol. 2025. PMID: 40122813 Free PMC article.
-
The role of wetland microorganisms in plant-litter decomposition and soil organic matter formation: a critical review.FEMS Microbiol Ecol. 2018 Nov 1;94(11). doi: 10.1093/femsec/fiy175. FEMS Microbiol Ecol. 2018. PMID: 30169564 Review.
-
Influences of evergreen gymnosperm and deciduous angiosperm tree species on the functioning of temperate and boreal forests.Biol Rev Camb Philos Soc. 2015 May;90(2):444-66. doi: 10.1111/brv.12119. Epub 2014 Jun 11. Biol Rev Camb Philos Soc. 2015. PMID: 24916992 Review.
References
-
- Mitsch W.J., Bernal B., Nahlik A.M., Mander U., Zhang L., Anderson C.J., Jorgensen S.E., Brix H. Wetlands, carbon, and climate change. Landsc. Ecol. 2013;28:583–597. doi: 10.1007/s10980-012-9758-8. - DOI
-
- Nie X.Q., Wang D., Yang L.C., Zhou G.Y. Storage and Climatic Controlling Factors of Litter Standing Crop Carbon in the Shrublands of the Tibetan Plateau. Forests. 2019;10:987. doi: 10.3390/f10110987. - DOI
LinkOut - more resources
Full Text Sources
Miscellaneous
