

Non-Alcoholic Beer Influences Glucose and Lipid Metabolism and Changes Body Composition in Healthy, Young, Male Adults
- PMID: 40431365
- PMCID: PMC12114185
- DOI: 10.3390/nu17101625
Non-Alcoholic Beer Influences Glucose and Lipid Metabolism and Changes Body Composition in Healthy, Young, Male Adults
Abstract
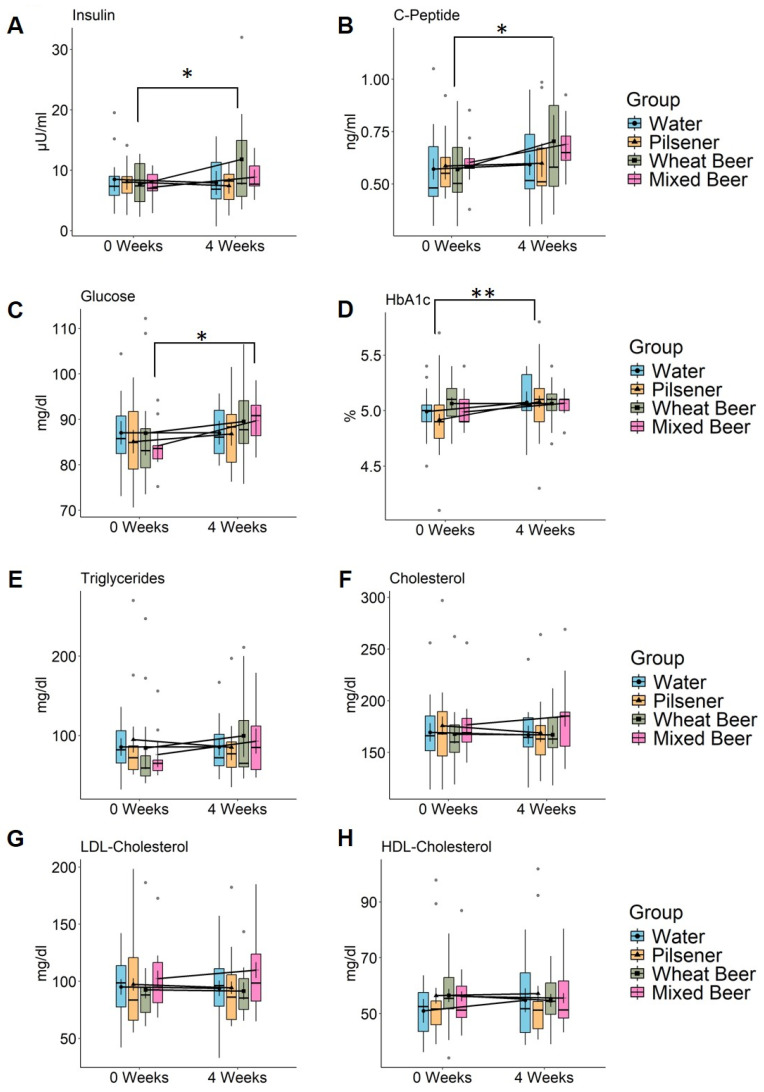
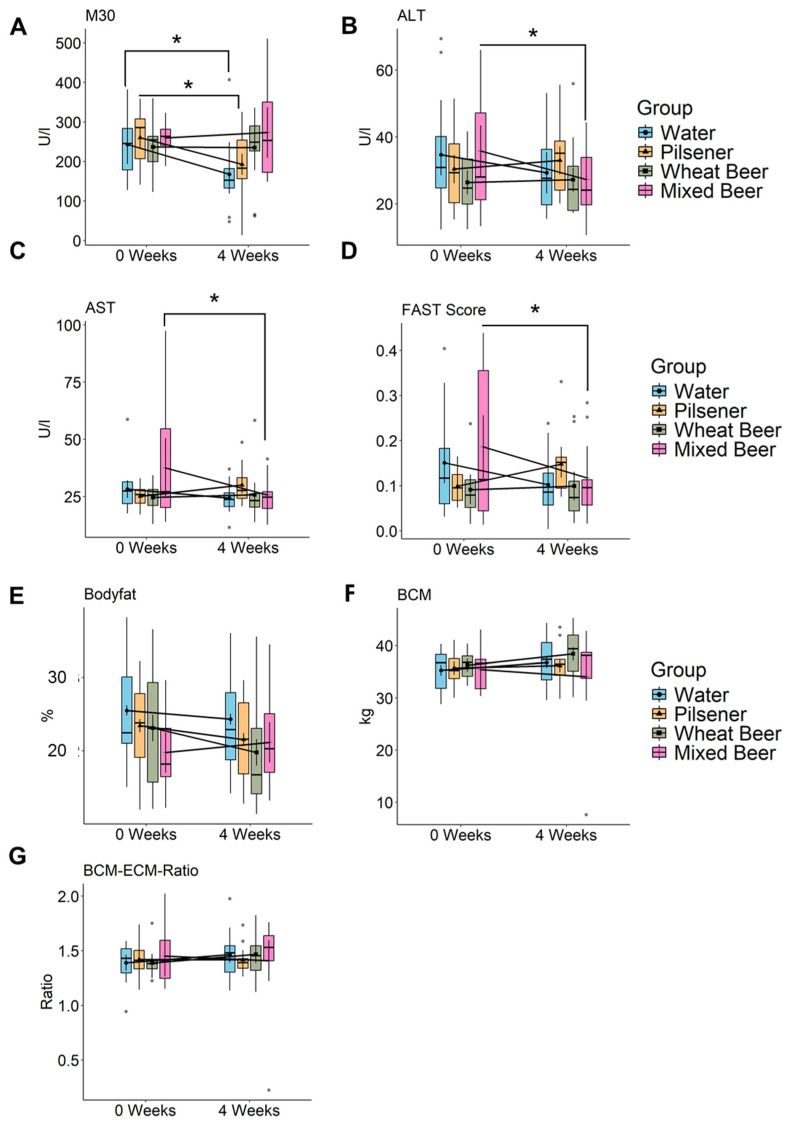
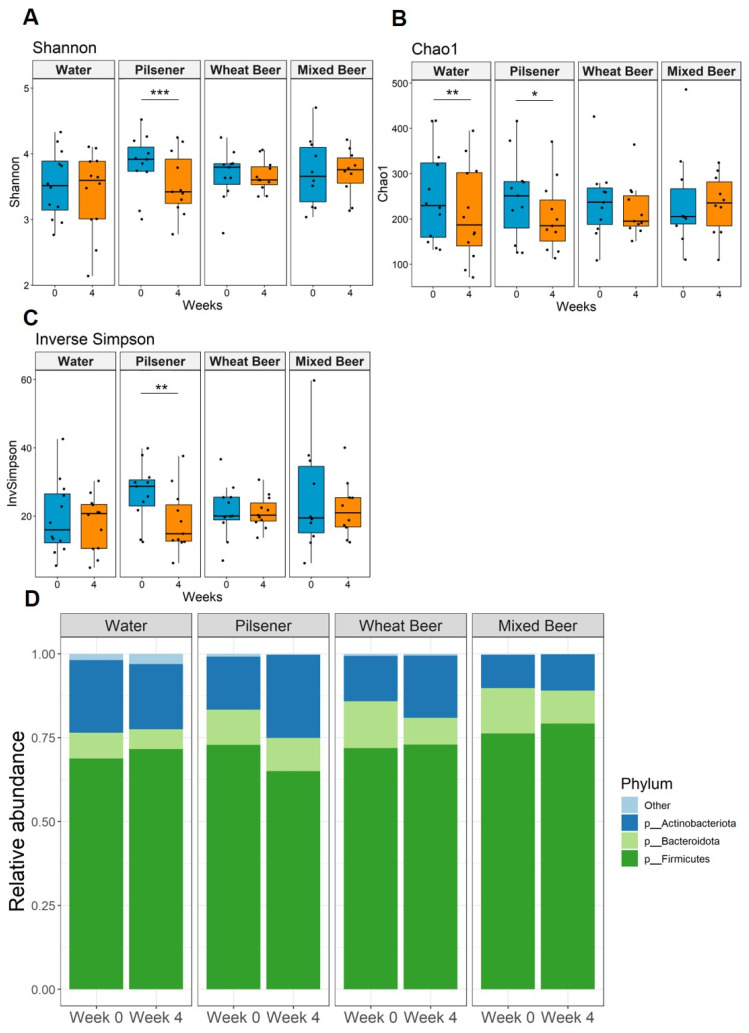
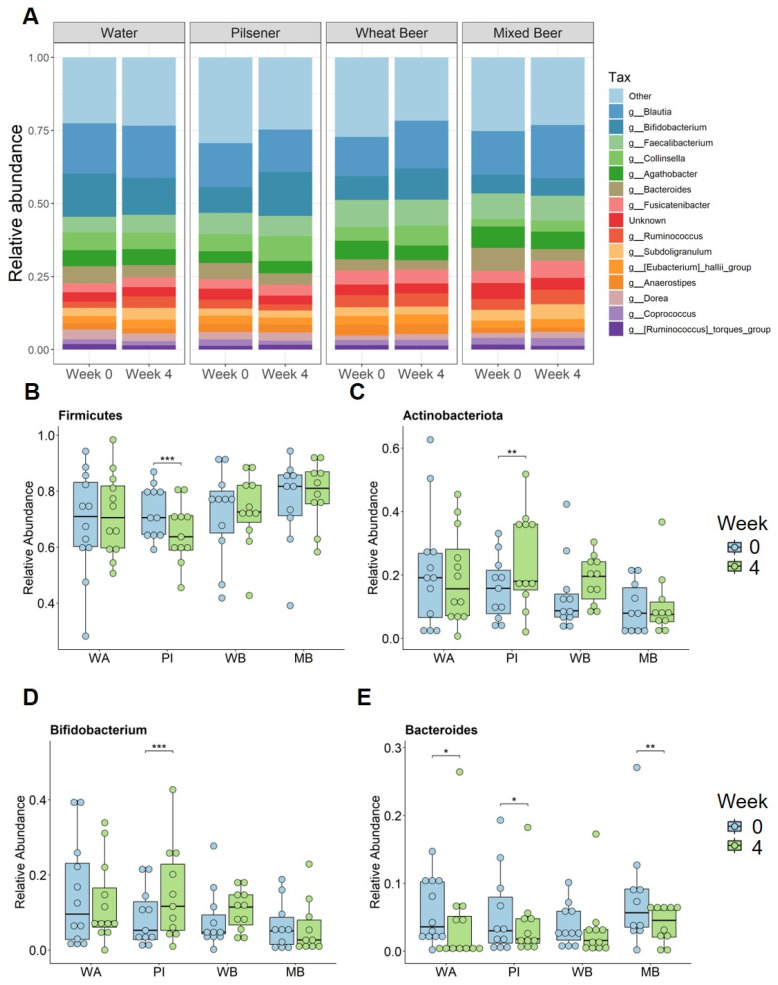
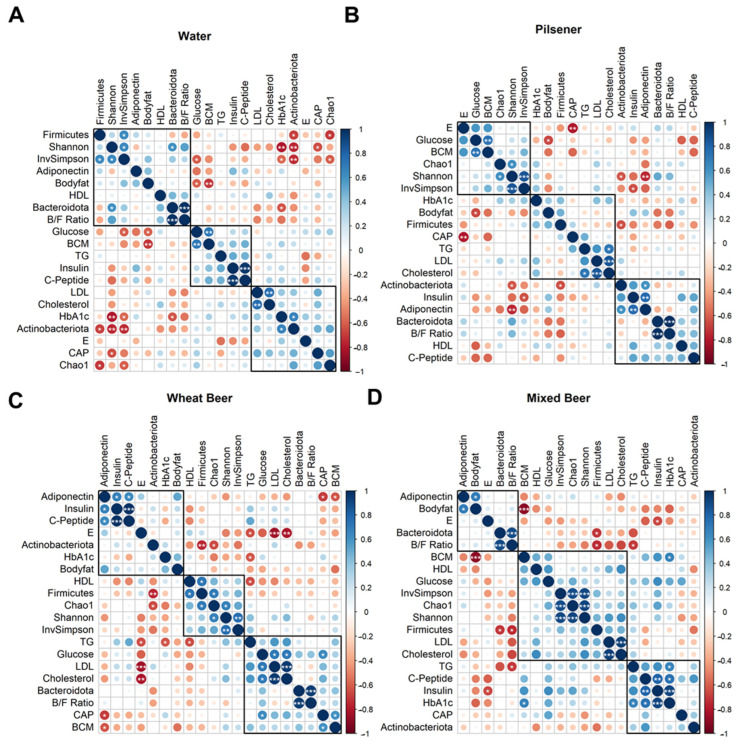
Background and Aims: Non-alcoholic beers (NABs) are gaining popularity as alternatives to alcoholic beverages, yet their metabolic and health effects compared to no consumption of these drinks remain unclear. Material and Methods: The investigator-blinded, single-center, randomized study compares the effects on the metabolism, health, and gut microbiome of the daily consumption of different NABs-pilsener, mixed beer, and wheat beer-on glucose and fat metabolism, body composition, and liver function in 44 healthy young men. The participants consumed 660 mL of one of these beers or water daily for 4 weeks. We measured indicators of glucose and lipid metabolism, liver enzymes, body composition, and the composition of the gut microbiota. Results: The findings revealed that mixed beer increased fasting glucose and triglycerides, and wheat beer increased insulin, C-peptide, and triglycerides. The intake of pilsener and water decreased cholesterol and LDL levels without significantly affecting glucose metabolism. Biomarkers of liver damage such as M30 lowered in water and pilsener, while ALT and AST lowered in mixed beer. The pattern of the gut microbiota also changed, as pilsener lowered Firmicutes and increased Actinobacteria. Conclusions: In summary, consumption of NABs, especially mixed and wheat beers, exerts an unfavorable metabolic impact on glucose and fat, while pilsener and water are more favorable from a metabolic perspective. We concluded that the metabolic alterations seen are probably due to the caloric and sugar content in NABs, rather than polyphenols. The chronic effects of NABs on health should be evaluated in future studies.
Keywords: fat metabolism; glucose metabolism; liver; microbiome; non-alcoholic beer.
Conflict of interest statement
B.S. has been consulting for Ambys Medicine, Boehringer Ingelheim Pharma, Surrozen, and Takeda (prior 24 months). B.S.’s institution UC San Diego has received research support from Axial Biotherapeutics, ChromoLogic, CymaBay Therapeutics, Intercept Pharmaceuticals, and Prodigy Biotech (prior 24 months). B.S. is the founder of Nterica Bio. UC San Diego has filed several patents with B.S. as an inventor related to this work.
Figures
Similar articles
-
Influence of moderate beer consumption on human gut microbiota and its impact on fasting glucose and β-cell function.Alcohol. 2020 Jun;85:77-94. doi: 10.1016/j.alcohol.2019.05.006. Epub 2019 Jun 12. Alcohol. 2020. PMID: 31201859
-
Moderate Alcoholic Beer Consumption: The Effects on the Lipid Profile and Insulin Sensitivity of Adult Men.J Food Sci. 2017 Jul;82(7):1720-1725. doi: 10.1111/1750-3841.13746. Epub 2017 Jun 16. J Food Sci. 2017. PMID: 28621438
-
Impact of Beer and Nonalcoholic Beer Consumption on the Gut Microbiota: A Randomized, Double-Blind, Controlled Trial.J Agric Food Chem. 2022 Oct 19;70(41):13062-13070. doi: 10.1021/acs.jafc.2c00587. Epub 2022 Jun 15. J Agric Food Chem. 2022. PMID: 35834180 Free PMC article. Clinical Trial.
-
Beer and Microbiota: Pathways for a Positive and Healthy Interaction.Nutrients. 2023 Feb 7;15(4):844. doi: 10.3390/nu15040844. Nutrients. 2023. PMID: 36839202 Free PMC article. Review.
-
[Benefits of the beer polyphenols on the gut microbiota].Nutr Hosp. 2017 Oct 15;34(Suppl 4):41-44. doi: 10.20960/nh.1570. Nutr Hosp. 2017. PMID: 29156931 Review. Spanish.
References
-
- Griswold M.G., Fullman N., Hawley C., Arian N., Zimsen S.R., Tymeson H.D., Venkateswaran V., Tapp A.D., Forouzanfar M.H., Salama J.S., et al. Alcohol use and burden for 195 countries and territories, 1990–2016: A systematic analysis for the Global Burden of Disease Study 2016. Lancet. 2018;392:1015–1035. doi: 10.1016/S0140-6736(18)31310-2. - DOI - PMC - PubMed
-
- Bryazka D., Reitsma M.B., Griswold M.G., Abate K.H., Abbafati C., Abbasi-Kangevari M., Abbasi-Kangevari Z., Abdoli A., Abdollahi M., Abdullah A.Y.M., et al. Population-level risks of alcohol consumption by amount, geography, age, sex, and year: A systematic analysis for the Global Burden of Disease Study 2020. Lancet. 2022;400:185–235. doi: 10.1016/S0140-6736(22)00847-9. - DOI - PMC - PubMed
-
- Naudin S., Li K., Jaouen T., Assi N., Kyrø C., Tjønneland A., Overvad K., Boutron-Ruault M., Rebours V., Védié A., et al. Lifetime and baseline alcohol intakes and risk of pancreatic cancer in the European Prospective Investigation into Cancer and Nutrition study. Int. J. Cancer. 2018;143:801–812. doi: 10.1002/ijc.31367. - DOI - PMC - PubMed
Publication types
MeSH terms
Substances
Grants and funding
LinkOut - more resources
Full Text Sources
Medical
