. 2025 May 10;17(10):1634.
doi: 10.3390/nu17101634.

Long-Term Supplementation of GABA Regulates Growth, Food Intake, Locomotion, and Lipid Metabolism by Increasing Ghrelin and Growth Hormone in Adolescent Mice

Affiliations

Long-Term Supplementation of GABA Regulates Growth, Food Intake, Locomotion, and Lipid Metabolism by Increasing Ghrelin and Growth Hormone in Adolescent Mice

Rafael Begazo-Jimenez et al. Nutrients. .

Abstract

Background/Objectives: The amino acid γ-aminobutyric acid (GABA) is the primary neurotransmitter in the central nervous system (CNS) and acts as an autocrine and/or paracrine signaling molecule in various types of non-neuronal cells. On the other hand, GABA is a nutrient found in a variety of foods and is marketed as a health supplement based on a growing number of studies reporting health benefits in humans and recuperations in animal models of diseases. The present study sought to examine whether supplementation of GABA to young mice regulates their growth as well as glucose and lipid metabolism during physiological adolescence. Methods: Mice were supplemented with GABA over a 16-week period with subsequent anthropometric, metabolic, and endocrine measurements. Results: Results showed that 16-week oral supplementation of GABA increased food consumption and body length while attenuating weight gain in male mice but not females. In addition, GABA treatment lowered the index of body fat (Lee index) and increased the expression of lipolytic enzymes in adipose and liver tissues of male mice without affecting blood glucose levels. Remarkably, supplementation of GABA significantly increased the protein expression of growth hormone (GH) in the pituitary gland of both male and female mice. However, it only substantially increased GH levels in the sera of male mice but not females. Moreover, GABA significantly increased the expression of the GH secretagogue peptide ghrelin in the stomachs of male mice only. Conclusions: Together these novel findings suggest that long-term GABA supplementation fundamentally influences the growth and lipid metabolism of males during adolescent development by stimulating ghrelin-GH production and secretion. The mechanisms of GABA-induced sex-dependent upregulations of ghrelin and GH, as well as lipid metabolism in adolescence, await further studies.

Keywords: GABA; adolescent development; ghrelin; growth hormone; lipid metabolism.


Conflict of interest statement

The authors declare no conflicts of interest.

Figures
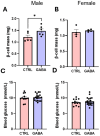
Figure A1
Figure A1
GABA treatment increases pancreatic β-cell mass in males but does not affect blood glucose concentrations in either sex. (A) Pancreatic β-cell mass among control and GABA-treated male mice (control: 1.21 ± 0.09 mg, n = 5; GABA-treated: 1.48 ± 0.09 mg, n = 6, p < 0.05). (B) β-cell mass between treated and untreated female mice (control: 1.11 ± 0.08 mg, n = 4; GABA-treated: 1.16 ± 0.02 mg, n = 4, p= 0.28). (C) Post-treatment blood glucose concentrations in male control and GABA-treated mice (control: 10.07 ± 0.38 mmol/L, n = 12; GABA-treated: 10.20 ± 0.24 mmol/L, n = 20, p = 0.75). (D) Blood glucose concentrations among GABA-treated and untreated females (control: 8.61 ± 0.30 mmol/L, n = 12; GABA-treated: 8.90 ± 0.28 mmol/L, n = 20, p = 0.51). Statistical significance indicated as * p < 0.05.
Figure A2
Figure A2
GABA supplementation increases the GH+ cell proliferation in male and female mice. (A) Representative immunofluorescence images of GH-positive cells (green) in the coronal pituitary sections of GABA-treated male mice (upper row) and control male mice (lower row). DAPI (blue) staining shows the total cell populations. (B) Bar graph representing the percentage of GH-positive cells in the pituitaries of GABA-treated and control males (control: 52.67 ± 7.78%, n = 4; GABA-treated males: 77.82 ± 6.36%, n = 4; p < 0.05). (C) Representative immunofluorescence images of GH-positive cells (green) and DAPI staining (blue) in the pituitary of GABA-treated female mice (upper row) and control females (lower row). (D) Percentage of GH-positive cells among control and GABA-treated females (control: 38.07 ± 3.26%, n = 4; GABA-treated females: 56.45 ± 5.92%, n = 4; p < 0.05). Statistical significance indicated as * p < 0.05.
Figure A3
Figure A3
(A) No sex differences in GABAAR expression. Representative Western blot of GABAAR (α1 subunit) and GAPDH loading control in untreated male and female mice. (B) Bar graph showing normalized GABAAR expression between male and female untreated mice (males: 0.21 ± 0.04, n = 4; females: 0.23 ± 0.30, n = 4; p = 0.69). Measured in arbitrary units by densitometry.
Figure A4
Figure A4
GABA supplementation does not significantly change the expression level of GHRH in the hypothalamus of male and female mice. (A) Representative immunoblots of pre-pro GHRH and GAPDH (loading control) in the hypothalamus of male control and GABA-treated mice. (B) Bar graph analysis of hypothalamic pre-pro GHRH normalized to GAPDH in male GABA-treated and untreated mice (control: 0.45 ± 0.05, n = 4; GABA-treated: 0.37 ± 0.05, n = 4; p = 0.31). (C) Representative blot of pre-pro GHRH and GAPDH in female treated and untreated mice. (D) Bar graph of normalized pre-pro GHRH expression in control and GABA-treated females (control: 0.75 ± 0.18, n = 4; GABA-treated: 0.51 ± 0.10, n = 4; p = 0.29).
Figure A5
Figure A5
Effects of GABA treatment on GHS-R expression in male mice. The immunohistochemical analyses show the expression of GHS-Rs (red) in GH+ cells (green) in coronal pituitary sections of control (A) and GABA-treated (B) male mice, with DAPI staining (blue) to visualize the cell density. (C) Bar graph showing the cell density of GHS-R-positive cells in the pituitaries of male treated and untreated mice (control: 0.010 ± 0.002, n = 4; GABA-treated: 0.014 ± 0.002, n = 4; p = 0.13). (D) Bar graph showing GHS-R immunofluorescence intensity in pituitary sections of control and GABA-treated males (control: 588.9 ± 30.55, n = 4; GABA-treated: 551.2 ± 28.69, n = 4; p = 0.40). (E) Representative Western blot of GHS-R and GAPDH (loading control) in whole pituitary lysate of male treated and untreated mice. (F) Normalized GHS-R protein expression in the pituitaries of control and GABA-treated male mice (control: 0.61 ± 0.07, n = 4; GABA-treated: 0.39 ± 0.02, n = 4; p < 0.05). Statistical significance indicated as * p < 0.05.
Figure 1
Figure 1
GABA supplementation did not change water consumption. Measurements were performed weekly per cage (12 controls and 20 GABA-treated mice per sex). (A) The volumes of weekly average water consumption. (B) The average daily water intake by GABA-treated male mice compared to controls (control: 5.28 ± 0.11 mL, n = 3 cages; GABA-treated: 5.25 ± 0.08 mL, n = 5). (C) Analysis of the area under the curve (AUC) of 16-week water consumption between the control and treated males (control: 84.75 ± 1.75 mL, n = 3; GABA-treated: 83.89 ± 1.8 mL, n = 5). (D) Volumes of weekly average water consumption by control and GABA-treated female mice. (E) Average daily water consumption between control and GABA-treated female mice (control: 3.98 ± 0.14 mL, n = 3; GABA-treated: 3.99 ± 0.14 mL, n = 5). (F) Analyses of AUC of 16-week water consumption between the control and treated females (control: 62.89 ± 1.47 mL, n = 3; GABA-treated: 63.95 ± 1.49 mL, n = 5).
Figure 2
Figure 2
GABA supplementation increases food consumption in male mice. Measurements were performed weekly per cage in 12 controls and 20 GABA-treated mice per sex. (A) Longitudinal line plot of the average weekly food intake by control and GABA-treated males. (B) Average daily food intake of GABA-treated male mice compared to controls (control: 4.15 ± 0.04 g, n = 3 cages; GABA-treated: 4.44 ± 0.06 g, n = 5; p < 0.05). (C) Analyses of the AUC of the 16-week food intake between GABA-treated males and controls (control: 66.29 ± 0.35 g, n = 3; GABA-treated: 70.8 ± 0.59 g, n = 5; p < 0.0001). (D) Weekly food consumption by control and GABA-treated females during the 16-week treatment period. (E) The average daily food intake by GABA-treated females compared to controls (control: 3.58 ± 0.11 g, n = 3; GABA-treated: 3.71 ± 0.1 g, n = 5; p = 0.41). (F) AUC analysis of 16-week food intake between GABA-treated and control females (control: 57.13 ± 0.66 g, n = 3; GABA-treated: 59.05 ± 0.89 g, n = 5; p = 0.09). Statistical significance indicated as * p < 0.05, **** p < 0.0001.
Figure 3
Figure 3
GABA supplementation reduces the bodyweight gain of male mice but not female mice. (A) Pre-treatment bodyweight of controls compared to GABA-treated males (control: 23.81 ± 0.34 g, n = 20; GABA-treated: 24.59 ± 0.26 g, n = 32; p = 0.07). (B) Post-treatment bodyweight of control and GABA-treated males (control: 34.29 ± 0.44 g, n = 20; GABA-treated: 32.62 ± 0.37 g, n = 32; p < 0.01). (C) Box plots of total bodyweight gain between control and GABA-treated males (control: 10.49 ± 0.23 g, n = 20; GABA-treated: 8.03 ± 0.22 g, n = 32; p < 0.0001). (D) Baseline bodyweight of the female controls compared to the GABA-treated mice (control: 19.9 ± 0.27 g, n = 20; GABA-treated: 20.11 ± 0.19 g, n = 32). (E) Post-treatment bodyweight of control and GABA-treated females (control: 24.82 ± 0.38 g, n = 20; GABA-treated: 25.08 ± 0.34 g, n = 32). (F) Bodyweight gain of control females versus the GABA-treated group (control: 4.92 ± 0.37 g, n = 20; GABA-treated: 4.97 ± 0.22 g, n = 32). Statistical significance indicated as ** p < 0.01, **** p < 0.0001.
Figure 4
Figure 4
GABA supplementation enhances the growth of body length and decreases Lee index in male mice but not of females. (A) Baseline nasoanal length of control (91.33 ± 0.74 mm, n = 12) and GABA-treated males (90.90 ± 0.32 mm, n = 20). (B) Nasoanal length of GABA-treated males compared to controls after the 16-week treatment (control: 99.83 ± 0.27 mm, n = 12; GABA-treated: 101.0 ± 0.25 mm, n = 20, p < 0.01). (C) Pre-treatment nasoanal lengths of control females compared to the GABA-treated group (control: 85.33 ± 0.40 mm, n = 12; GABA-treated: 85.35 ± 0.47 mm, n = 20). (D) Post-treatment nasoanal length of control and GABA-treated females (control: 96 ± 0.67 mm, n = 12; GABA-treated: 96.4 ± 0.38 mm, n = 20). (E) Box and whisker plots of the Lee index of GABA-treated male mice compared to controls in arbitrary units (control: 321.7 ± 1.03, n = 12; GABA-treated: 314.7 ± 0.85, n = 20; p < 0.0001). (F) Lee index of control and GABA-treated females (control: 300.7 ± 1.07, n = 12; GABA-treated females: 300.4 ± 1.52, n = 20). Lee index is calculated in arbitrary units. Statistical significance indicated as ** p < 0.01, **** p < 0.0001.
Figure 5
Figure 5
GABA supplementation exerts sex-specific effects on metabolism and locomotor activity. (A) Post-treatment energy expenditure between control and GABA-treated male mice during the light (control: 0.356 ± 0.018, n = 8; GABA-treated: 0.384 ± 0.015, n = 8) and dark (control: 0.413 ± 0.022, n = 8; GABA-treated: 0.440 ± 0.017, n = 8) phases. (B) Total locomotor activity in GABA-treated and control mice during the light (control: 1484 ± 117, n = 8; GABA-treated: 2357 ± 246, n = 8; p = 0.0064) and dark (control: 3212 ± 252, n = 8; GABA-treated: 4322 ± 375, n = 8; p = 0.0278) phases. (C) Active activity among control and GABA-treated males during the light (control: 593 ± 45, n = 8; GABA-treated: 1121 ± 151, n = 8; p = 0.0048) and dark (control: 1600 ± 148, n = 8; GABA-treated: 2214 ± 187, n = 8; p = 0.0221) phases. (D) Sleep duration between GABA-treated males and controls during the light (control: 439 ± 26, n = 8; GABA-treated: 427 ± 15, n = 8) and dark (control: 296 ± 23, n = 8; GABA-treated: 285 ± 24, n = 8) phases. (E) Energy expenditure among GABA-treated females during the light (control: 0.306 ± 0.013, n = 8; GABA-treated: 0.354 ± 0.011, n = 8; p = 0.0138) and dark (control: 0.369 ± 0.007, n = 8; GABA-treated: 0.440 ± 0.011, n = 8; p < 0.0001) phases. (F) Total activity among GABA-treated and control females during the light (control: 2158 ± 0.244, n = 8; GABA-treated: 2840 ± 189, n = 8; p = 0.044) and dark (control: 4627 ± 545, n = 8; GABA-treated: 7827 ± 189, n = 8; p = 0.041) phases. (G) Active activity between control and GABA-treated females during the light (control: 1073 ± 175, n = 8; GABA-treated: 1581 ± 134, n = 8; p = 0.0368) and dark (control: 2251 ± 292, n = 8; GABA-treated: 5330 ± 924, n = 8; p = 0.0067) phases. (H) Sleep time during the dark (control: 273 ± 16, n = 8; GABA-treated: 202 ± 12, n = 8; p = 0.0039) and light (control: 422 ± 16, n = 8; GABA-treated: 404 ± 15, n = 8) phases among GABA-treated females and controls. Statistical significance indicated as * p < 0.05.
Figure 6
Figure 6
GABA treatment increases phosphorylation of HSL in adipose tissues of male mice. (A) Representative immunoblots of HSL and GAPDH (loading control) in adipose tissue from control and GABA-treated male mice. (B) Bar graph displaying HSL expression normalized to GAPDH between control and GABA-treated males (control: 1.45 ± 0.15, n = 4; GABA-treated: 1.403 ± 0.07, n = 4). (C) Representative blot of p-HSL and GAPDH expression in adipose tissues. (D) Normalized p-HSL expression in adipose tissue of male GABA-treated mice compared to controls (control: 0.65 ± 0.21, n = 4; GABA-treated: 1.24 ± 0.12, n = 4; p < 0.05). Data measured in arbitrary units by densitometry. Statistical significance indicated as * p < 0.05.
Figure 7
Figure 7
GABA supplementation significantly increases the levels of GH in the sera and pituitary of male mice. (A) Serum GH concentrations in GABA-treated male mice compared to controls (control: 5.37 ± 0.34 ng/mL, n = 10; GABA-treated: 15.29 ± 4.14 ng/mL, n = 12; p < 0.05). (B) Serum GH concentration among GABA-treated and control females (control: 8.73 ± 1.77 ng/mL, n = 8; GABA-treated: 10.42 ± 2.66 ng/mL, n = 8; p = 0.61). (C) Representative immunoblots of GH protein and the loading control GAPDH in the pituitaries of control and GABA-treated males. (D) Bar graph displays the ratio of GH/GAPDH between GABA-treated males and controls (control: 1.50 ± 0.19, n = 4; GABA-treated: 2.34 ± 0.13, n = 4; p < 0.05). (E) Representative immunoblots of GH protein and GAPDH in the pituitaries of control and GABA-treated females. (F) Normalized GH protein in the pituitary of GABA-treated females compared to controls (control: 2.14 ± 0.12, n = 4; GABA-treated: 2.56 ± 0.10, n = 4; p < 0.05). Western blot data measured in arbitrary units by densitometry. Statistical significance indicated as * p < 0.05.
Figure 8
Figure 8
Effect of GABA supplementation on GH downstream effectors in the liver of male mice. (A) Representative immunoblots of pro-IGF1, mature IGF1, and GAPDH loading control in whole liver lysates from control and GABA-treated male mice. (B) Bar graph showing the normalized expression of pro-IGF1 in GABA-treated and control males (control: 2.81 ± 0.26, n = 4; GABA-treated: 2.00 ± 0.16, n = 4; p < 0.05). (C) Normalized expression of mature IGF1 in GABA-treated males compared to controls (control: 1.41 ± 0.27, n = 4; GABA-treated: 2.43 ± 0.29, n = 4; p < 0.05). (D) Representative blot of p-AKT and GAPDH expression in the livers of control and GABA-treated male mice. (E) Normalized p-AKT expression among control and GABA-treated males (control: 0.98 ± 0.05, n = 4; GABA-treated: 1.51 ± 0.19, n = 4; p < 0.05). (F) Representative blot of liver HSL and GAPDH expression in control and treated male mice. (G) HSL expression after GABA treatment between control and GABA-treated males (control: 0.76 ± 0.07, n = 4; GABA-treated: 0.63 ± 0.18, n = 4). (H) Representative blot of MGL and GAPDH in the livers of control and GABA-treated males. (I) MGL expression among GABA-treated male mice compared to controls (control: 1.11 ± 0.09, n = 4; GABA-treated: 2.06 ± 0.37, n = 4; p < 0.05). Data measured in arbitrary units by densitometry. Statistical significance indicated as * p < 0.05.
Figure 9
Figure 9
GABA supplementation increases the level of ghrelin in the stomach of male mice but not females. (A) Upper image shows immunofluorescence of the α1-subunit of the GABAARs (yellow), and ghrelin (green) and DAPI staining (blue). Lower image shows immunofluorescences of ghrelin and DAPI staining. Arrows represent ghrelin colocalized with GABAARs. (B) Representative immunoblots of ghrelin protein and GAPDH (loading control) in the stomach of non-treated males and females. (C) Bar graph displays ghrelin normalized to GAPDH in control females and males (males: 1.14 ± 0.06, n = 4; females: 1.80 ± 0.08, n = 4, p < 0.001). (D) Representative immunoblots of ghrelin protein and GAPDH in control and GABA-treated males. (E) Normalized ghrelin expression in control and GABA-treated males (control: 0.71 ± 0.10, n = 4; GABA-treated: 1.50 ± 0.18, n = 4, p < 0.01). (F) Representative immunoblots of ghrelin protein and GAPDH in control and GABA-treated females. (G) Normalized ghrelin expression among GABA-treated and untreated females (control: 2.22 ± 0.16, n = 4; GABA-treated: 2.07 ± 0.10, n = 4, p = 0.46). Data are measured in arbitrary units by densitometry. Statistical significance indicated as ** p < 0.01, *** p < 0.001.

Similar articles

References

    1. Wu G. Amino Acids: Metabolism, Functions, and Nutrition. Amino Acids. 2009;37:1–17. doi: 10.1007/s00726-009-0269-0. - DOI - PubMed
    1. Owens D.F., Kriegstein A.R. Is There More to Gaba than Synaptic Inhibition? Nat. Rev. Neurosci. 2002;3:715–727. doi: 10.1038/nrn919. - DOI - PubMed
    1. Mendu S.K., Bhandage A., Jin Z., Birnir B. Different Subtypes of GABA-A Receptors Are Expressed in Human, Mouse and Rat T Lymphocytes. PLoS ONE. 2012;7:e42959. doi: 10.1371/journal.pone.0042959. - DOI - PMC - PubMed
    1. Januzi L., Poirier J.W., Maksoud M.J.E., Xiang Y.-Y., Veldhuizen R.A.W., Gill S.E., Cregan S.P., Zhang H., Dekaban G.A., Lu W.-Y. Autocrine GABA Signaling Distinctively Regulates Phenotypic Activation of Mouse Pulmonary Macrophages. Cell. Immunol. 2018;332:7–23. doi: 10.1016/j.cellimm.2018.07.001. - DOI - PubMed
    1. Xiang Y.-Y., Wang S., Liu M., Hirota J., Li J., Ju W., Fan Y., Kelly M., Ye B., Orser B., et al. A GABAergic System in Airway Epithelium Is Essential for Mucus Overproduction in Asthma. Nat. Med. 2007;13:862–867. doi: 10.1038/nm1604. - DOI - PubMed

LinkOut - more resources