. 2025 Apr 30;12(5):427.
doi: 10.3390/vetsci12050427.

Development of a Paper-Based Microfluidic Chip for Point-of-Care Detection of PEDV

Affiliations

Development of a Paper-Based Microfluidic Chip for Point-of-Care Detection of PEDV

Renfeng Li et al. Vet Sci. .

Abstract

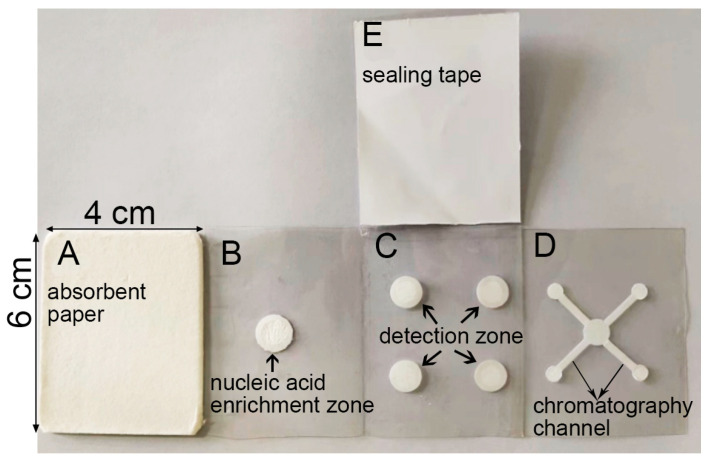
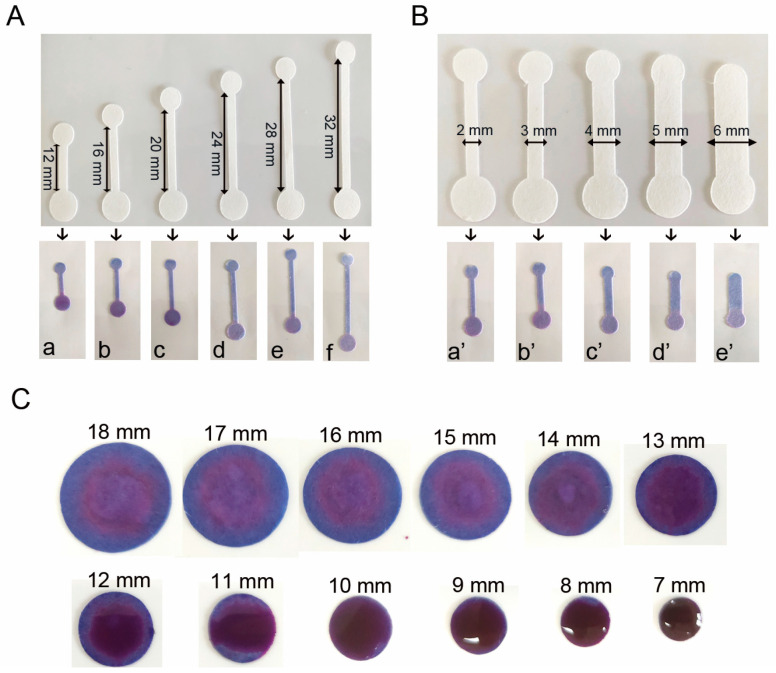
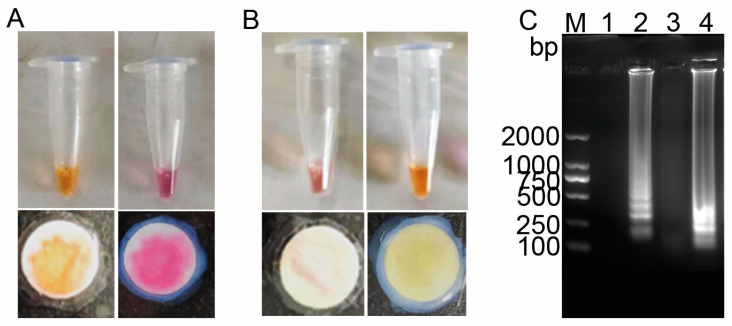
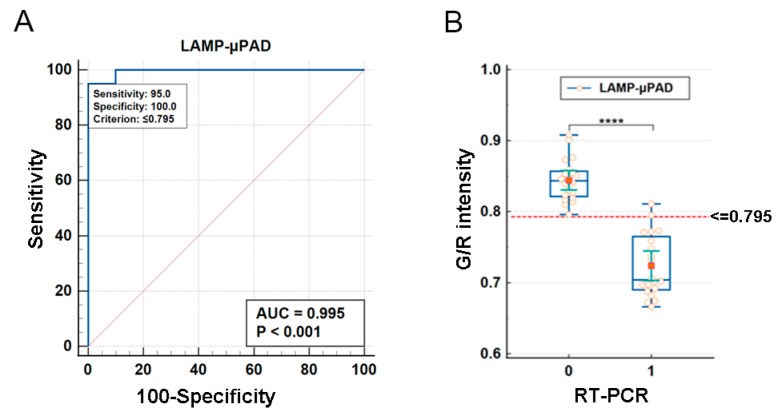
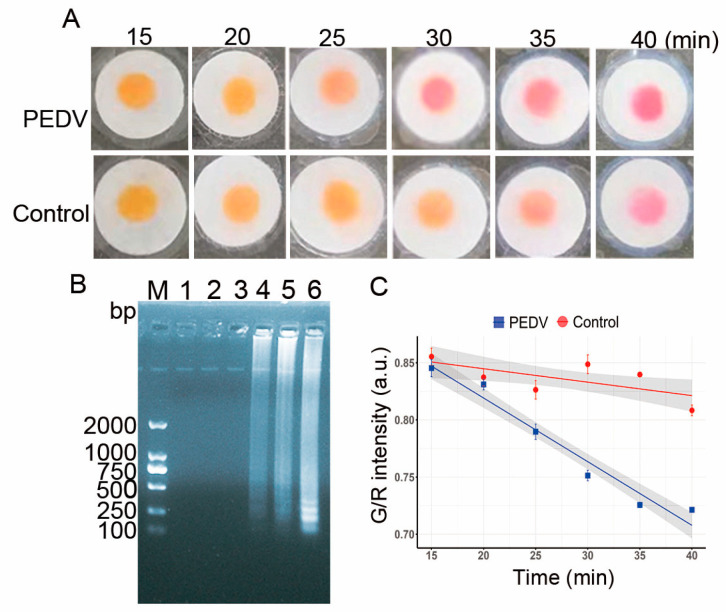
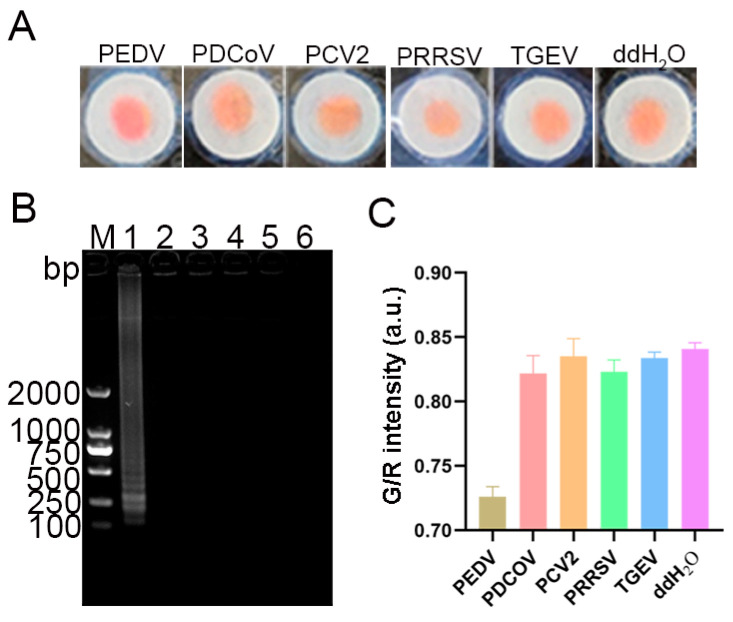
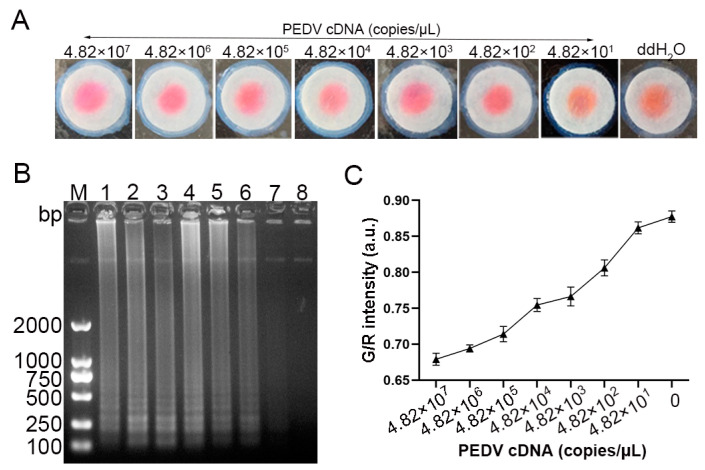
PEDV poses a significant threat to the global swine industry, necessitating rapid and accurate diagnostic methods for effective disease management. In this study, we developed a foldable, easy-to-use paper-based microfluidic analytical device (μPAD) for on-site detection of PEDV. The device seamlessly integrates paper-based nucleic acid enrichment, LAMP reaction, and visual lateral flow detection into a single platform. Key parameters, including nucleic acid extraction protocols, chromatographic channel configurations, colorimetric indicators, and reaction temperature and duration, were systematically optimized. The resulting LAMP-μPAD assay detects PEDV within 30 min at 60 °C, achieving a limit of detection of 4.82 × 10² copies/μL with no cross-reactivity against other viruses. When evaluated against RT-PCR using clinical specimens, the assay demonstrated a specificity of 100%, a sensitivity of 95.3%, and an overall concordance of 98.5%. This paper-based sensor offers a promising alternative for the rapid, on-site detection of PEDV and other highly transmissible pathogens.

Keywords: loop-mediated isothermal amplification; paper-based microfluidic analytical device; point-of-care detection; porcine epidemic diarrhea virus.


Conflict of interest statement

The authors declare no conflicts of interest.

Figures

Figure 1
Figure 1
Photograph of the LAMP-μPAD. (A) Waste liquid zone. (B) Nucleic acid enrichment zone. (C) Nucleic acid amplification zone. (D) Nucleic acid chromatography zone. (E) Film sealing tape.
Figure 2
Figure 2
Screening of PEDV RT-LAMP primer sets. M for 2000 bp DNA marker, lanes 1 and 2 represent the positive and negative amplification results of primer set 1, respectively; lanes 3 and 4 for primer set 2; lanes 5 and 6 for primer set 3; lanes 7 and 8 for primer set 4; lanes 9 and 10 for primer set 5; lanes 11 and 12 for primer set 6; lanes 13 and 14 for primer set 7; lanes 15 and 16 for primer set 8; lanes 17 and 18 for primer set 9; lanes 19 and 20 for primer set 10; lanes 21 and 22 for primer set 11. Red rectangular frames highlight primer set 2, which was selected as the optimal primer pair based on specificity and amplification efficiency analyses.
Figure 3
Figure 3
Development of RT-LAMP assay and application on different types of paper. (A) RT-LAMP for PEDV testing. M: DL2000 DNA marker; 1: negative control (ddH2O); 2: PEDV positive. (B) Comparative analysis of paper types for nucleic acid amplification zone. M: DL2000 DNA marker; 1 and 2 represent PEDV negative and positive amplification using RT-LAMP on Whatman No. 1 filter paper, respectively; 3 and 4 represent PEDV negative and positive amplification using RT-LAMP on NC membrane, respectively. (n = 5).
Figure 4
Figure 4
Screening of nucleic acid lysis buffers. (A) Concentration measurements using ultra-micro nucleic acid protein analyzer. (B) RT-PCR results. M: DL2000 DNA marker; Lane 1: Lysis buffer I; Lane 2: Lysis buffer II; Lane 3: Lysis buffer III; Lane 4: RNA extraction kit. (C) qPCR results. (D) RNA agarose gel electrophoresis results. Lane 1: Lysis buffer I; Lane 2: Lysis buffer II; Lane 3: Lysis buffer III; Lane 4: RNA extraction kit. (* indicates comparison between groups, ns denotes non-significant differences, ** p < 0.01, **** p < 0.0001, n = 3).
Figure 5
Figure 5
Optimization of nucleic acid chromatography channel geometry. (A) Channel length optimization (af: 12, 16, 20, 24, 28, and 32 mm, respectively). (B) Channel width optimization (a’e’: 2, 3, 4, 5, and 6 mm, respectively). (C) Dimensional optimization of amplification reaction chambers for nucleic acid detection. (n = 5).
Figure 6
Figure 6
Comparison of colorimetric indicators. (A) Neutral red and (B) cresol red color transitions before and after LAMP amplification. (C) Agarose gel electrophoresis analysis. Lane M: DL2000 DNA marker; Lanes 1 and 2: electrophoresis results of neutral red before and after LAMP amplification, respectively; Lanes 3 and 4: electrophoresis results of cresol red before and after LAMP amplification, respectively (n = 5).
Figure 7
Figure 7
Cut-off value and diagnostic performance evaluation of the LAMP-μPAD assay. (A) Determination of Cut-off value. (B) ROC curve for diagnostic performance evaluation. (**** p < 0.0001).
Figure 8
Figure 8
Time-dependent analysis of the LAMP-μPAD assay. (A) Colorimetric results on paper chips for PEDV and negative control. (B) Time course analysis by agarose gel electrophoresis. M: DL2000 DNA marker; Lanes 1–6 represent 15, 20, 25, 30, 35, and 40 min, respectively. (C) Regression analysis of G/R intensity versus reaction time (error bars represent standard deviation from five replicates for each time point) (n = 5).
Figure 9
Figure 9
Specificity analysis of the LAMP-μPAD assay. (A) Visual colorimetric detection results on paper chips. (B) Agarose gel electrophoresis analysis. M: DL2000 DNA marker; Lanes 1–6 represents PEDV, PDCoV, PCV2, PRRSV, TGEV and ddH2O, respectively. (C) Quantitative analysis of colorimetric intensity (G/R).
Figure 10
Figure 10
Sensitivity evaluation of the LAMP-μPAD assay. (A) Visual detection results on the paper chips at different template concentrations. (B) Agarose gel electrophoresis analysis. M: DL2000 DNA marker; Lanes 1–7: Serial dilutions of template from 4.82 × 10⁷ to 4.82 × 101 copies/μL; Lane 8: negative control (ddH2O). (C) G/R ratio changes across plasmid concentration gradients. (n = 5).

Similar articles

References

    1. Pensaert Mb Fau-de Bouck P., de Bouck P. A New Coronavirus-like Particle Associated with Diarrhea in Swine. Arch. Virol. 1978;58:243–247. doi: 10.1007/BF01317606. - DOI - PMC - PubMed
    1. Luo H., Liang Z., Lin J., Wang Y., Liu Y., Mei K., Zhao M., Huang S. Research progress of porcine epidemic diarrhea virus S protein. Front. Microbiol. 2024;15:1396894. doi: 10.3389/fmicb.2024.1396894. - DOI - PMC - PubMed
    1. Wood E.N. An apparently new syndrome of porcine epidemic diarrhoea. Vet. Rec. 1977;100:243–244. doi: 10.1136/vr.100.12.243. - DOI - PubMed
    1. Zhang Y., Chen Y., Zhou J., Wang X., Ma L., Li J., Yang L., Yuan H., Pang D., Ouyang H. Porcine Epidemic Diarrhea Virus: An Updated Overview of Virus Epidemiology, Virulence Variation Patterns and Virus–Host Interactions. Viruses. 2022;14:2434. doi: 10.3390/v14112434. - DOI - PMC - PubMed
    1. Fu Y., Li B., Liu G. Rapid and efficient detection methods of pathogenic swine enteric coronaviruses. Appl. Microbiol. Biotechnol. 2020;104:6091–6100. doi: 10.1007/s00253-020-10645-5. - DOI - PMC - PubMed

LinkOut - more resources